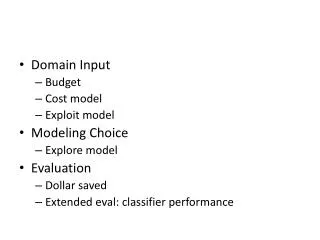
Fuel Choice Model
Analysis of gas and electric appliance competitiveness in space and water heating, highlighting conversions and impact on energy consumption over 20 years from a regional planning perspective.

Fuel Choice Model
E N D
Presentation Transcript
Fuel Choice Model The Total Resource Cost (TRC) Perspective Michael Schilmoeller 10/27/2011 (revised)
Summary-TRC Perspective • Over 20 years • 340 MWa decline in power use due to net conversion to gas • 13.1 x 10¹² BTUs per year increase in direct gas use, but about 7 x 10¹² BTUs per year decrease net of power generation (power generation use declines 20 x 1012 BTUs per year ) • 2,593,900 existing households • Annually (just divide by 20) • 17 MWa decline in power use due to net conversion to gas • 657 x 109 BTUs per year increase in direct gas use, but about 350 x 109 BTUs per year decrease net of power generation • 129,695 existing households
Similarity of Appliance PerformanceExample for Gas Tank (2) in Water Heating Choices Slide
Water Heating Choices129,693 households per year 15,010 households/yr 6,430 change to electricity -101.4 BTUs 10^9/yr 31,202 households/yr T 5,745 households/yr 5,745 change to gas 99.7 BTUs 10^9/yr T T T 13,379 households/yr 64,356 households/yr 21,197 change to gas 364.5 BTUs 10^9/yr
Similarity of Appliance PerformanceExample for HPWH (1) in Water Heating Choices Slide
Space Heating Choices129,693 households per year 6,019 households/yr T T 67 households/yr 15,343 households/yr T 4,793 households/yr 491 households/yr T T T T 72,919 households/yr799 change to gas 31.6 BTUs 10^9/yr 6,177 households/yr6,136 change to gas 247.2 BTUs 10^9/yr 4,111 households/yr 499 households/yr499 change to gas 15.7 BTUs 10^9/yr T T 19,275 households/yr
Summary • Gas and electric appliances for space and water heating have become competitive both in terms of efficiency and cost • Where the model selects a particular appliance, there are typically appliances using the alternative fuel with similar performance • Given the precision of our calculations, there is no clear winner • The total number of space heating conversions is small (7,434 annually or less than 6 percent of households) and are to gas from electricity. These households either • Use or will use gas for water heating anyway, or • Do not value the air conditioning that heat pumps can provide and require only a service extension for natural gas (not a main extension) • The total number of water heating conversions to gas from electricity is significant (26,942 annually or about 21 percent) • These households either already have natural gas for space heating or will add it to convert their space heating • The total number of water heating conversions to electricity from gas is small (6,430 annually or less than 6 percent) • These households have water heaters of greater than 55 gallon capacity and therefore must add a more efficient appliance. They select heat pump water heaters over gas water heat technology. • Again, the competition between gas and electric appliances is close. If condensing gas were chosen in lieu of a heat pump water heater, the effect over 20 years would be to lower the electric savings to 240 MWa from 340 MWa. From a regional planning perspective, this is small.