Forecast Accuracy and Model Choice
Forecast Accuracy and Model Choice. Keith Ord Georgetown University. Topics to be Discussed. Accuracy for activities with only Yes/No outcomes Forecast calibration: bias in transportation forecasts Measures of forecast performance Model choice. Some of the Issues.

Forecast Accuracy and Model Choice
E N D
Presentation Transcript
Forecast Accuracy and Model Choice Keith Ord Georgetown University
Topics to be Discussed • Accuracy for activities with only Yes/No outcomes • Forecast calibration: bias in transportation forecasts • Measures of forecast performance • Model choice
Some of the Issues • Does your organization formally track forecast accuracy? • If yes, do you have a target/goal for forecast accuracy? • If you have a target/goal for forecast accuracy, how is it set? • What accuracy measure do you use?
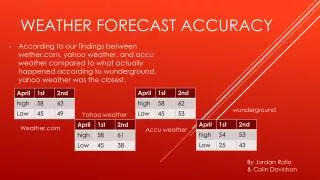
83% of those who responded do formally track forecast accuracy. However, of those who formally track forecast accuracy, only 79% had an accuracy target or goal. Further insights into this result are reflected in comments, which suggest that for some, the forecast is the “plan” and is part of the budgeting process as opposed to demand or supply chain planning. As one respondent noted, “We track our sales revenue against forecast, but I don’t know that we have a goal for accuracy other than 100%.” Source: Forecast Pro Newsletter, August 2009
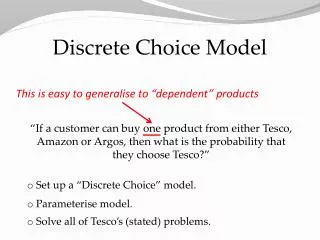
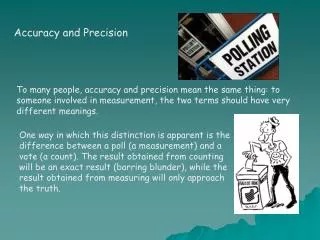
Will it Rain? • It rains in the DC area about 1 day in 4. • Accuracy Criterion: Maximize the percent correct • What should be the forecast? • Answer: never predict rain • Produces 75% correct answers • Any other forecast produces a lower percentage correct
Lack of Proper Calibration • The criterion is not properly calibrated because it does not encourage an appropriate answer • Ask: What is the probability of rain? • Let Y=1 if rain; Y=0 if no rain • Forecast P(R) = probability of rain
A Solution • Use Brier’s Score Function and seek minimum: • Example true P =0.7: • E(S|P=0.7)=0.21 • E(S|P=0.0)=0.70 • E(S|P=1.0)=0.30 • Ready extension to multinomial case
Measures of Bias for Quantitative Variables • Let Y = Actual, F = Forecast • BIAS: • PERCENT BIAS: • COMMON PRACTICE (e.g. Flyvbjerg, 2005)
A Few Comments • Forecasts of future traffic flows for new transportation projects in Europe tend to: • Overestimate rail traffic • Underestimate road traffic • See Flyvbjerg et al., 2006; Welde & Odeck, 2009 • Is the USA any different? Is the forecasting system properly calibrated or do biased forecasts produce extra (funding) benefits?
A possible solution • Reference class forecasting: build an historical data set of somewhat similar projects with actual outcomes and calibrate forecasts using a regression model • How to choose the reference set? • Use actual outcomes, first year or ramp-up effect?
Kahneman’s Story (from Flyvbjerg et al, 2006) • Team of academics and teachers working on a curriculum project; each was asked how long the project would take • Answers ranged from 18 to 30 months • Team was then asked “Think of a similar past project; how long did it take to complete?” • Answers ranged from 7 to 10 years • OUTCOME: Project was completed 8 years later!
Variability Measures for Quantitative Variables • Let Y = Actual, F = Forecast; m forecasts, either cross-sectional or time-series • (Forecast) Mean Square Error: • (Forecast) Mean Absolute Error: • These measures are scale-dependent
Variability Measures for Quantitative Variables, II • Remove scale dependence by looking at relative errors • (Forecast) Mean Absolute Error: • Requires positive data • Net profits • Rare events
Variability Measures for Quantitative Variables, III • For time series data, use the (Forecast) Mean Absolute Scaled Error: • Require MASE < 1 if method is to do better than a random walk (RW) • For cross-sectional data, replace RW by a suitable “naïve” model • For particular applications, other functions such as cost may be more appropriate
Model Choice: Prediction Validation [PVAL] • Suppose we have n+m observations (cross-sectional or time series) • Develop/estimate models using n observations and then compute the accuracy measures using the other m observations • For time series, the hold-out sample must be at the end of the series; for cross-sectional data, cross-validation is possible, holding out multiple sets of m, or alternatively “leave-one-out”
Model Choice: Information Criteria • The general form of information criteria is: • Here K= # parameters in the model and q(n) is a penalty function: • AIC (Akaike): q(n) = 2 • BIC (Schwartz): q(n) = log (n), etc. • Penalty included to avoid over-parametrization • Asymptotically, AIC minimizes forecast error, BIC selects the correct model with probability approaching 1.
Model Choice • AIC tends to work better than BIC for forecasting purposes (still a matter for debate) • PVAL is widely used in practice, but recent studies have suggested that AIC works better • For details, see Hyndman et al. (2008, chapter 7), who examine the M3 data and another large data set.
Summary Statistics Analysis performed using Forecast Pro
Conclusions • Choose accuracy measures that reflect both bias and variability • Accuracy measures should be properly calibrated relative to planning objectives • Accuracy measures should reflect the appropriate forecasting /planning horizon • Model choice may be based upon information criteria OR out-of-sample testing: both approaches have their advocates
References • Flyvbjerg, B. (2005) Transportation Research, Part A, 39, 522 – 530 • Flyvbjerg, B., Holm, M.K.S. and Buhl, S.L. (2006) Transportation Reviews, 26, 1 -24. • Hyndman, R.J., Koehler, A.B., Ord, J.K. and Snyder, R.D. (2008) Forecasting with Exponential Smoothing. Springer: New York • Welde, M. and Odeck, J. (2009) Do planners get it right? Paper presented at the International Transport Economics Conference at the University of Minnesota in June.