Download
1 / 95
1k likes | 1.3k Vues
Water Resources. Carly Vaughn, Kathyrn Jones, and Clarissa Guzman. http://images.google.com/images?q=waterfall&hl=en&lr=&sa=N&tab=wi&sourceid=tipimg. Water Resources. Introduction The Global Distribution of Water The Hydrologic Cycle Precipitation and Evaporation Patterns

E N D
Water Resources Carly Vaughn, Kathyrn Jones, and Clarissa Guzman http://images.google.com/images?q=waterfall&hl=en&lr=&sa=N&tab=wi&sourceid=tipimg
Water Resources • Introduction • The Global Distribution of Water • The Hydrologic Cycle • Precipitation and Evaporation Patterns • Surface Water – Rivers and Lakes • Groundwater • Ice Caps and Glaciers • Surface Runoff, Floods, and Flood Control
Introduction • Most abundant resource • Covers ¾ of Earth • Most necessary to us than any other resource • Strain capabilities of supply system for areas of limited freshwater • Increase awareness of the need to use water for preservation of the environment
Global Distribution • Total amount of water 1.36 x 10^6 Km^3 • 97.2% in oceans • 2.15% frozen in ice caps • .65% freshwater • Problems with water supply • Local distribution patterns • Rates of recharge and natural loss • Cleanliness of water • Availability of potable water determines population of any geographic area
The Hydrologic Cycle • Water constantly in motion • Atmosphere draws up water by evaporation, transports water vapor, condenses to clouds, and discharges as rain or snow • Each region has natural water budget • precipitation • evapotranspiration • runoff
The Hydrologic Cycle • Water has high heat capacity • Calories per gram • Evaporation – 540 • Condensation – 540 • Melting of ice – 80 • Controls the world’s climates (transport thermal energy) • Atmosphere • Ocean currents • Example – Gulf Stream
Precipitation Patterns • Unevenly distributed • Results from Earth’s reception of solar energy and convection currents increase precipitation • Increases in temperate regions • Decreases in polar regions • Rising of warm, damp air into atmosphere where cooling reduces the capacity to hold water • High precipitation near equator • Arid regions air descends from upper atmosphere and ability to hold water increases causing water to be absorbed
Precipitation Patterns • Also effected by ocean currents • Ex – Humbolt Current extends desert conditions up west coast of U.S. • The rate of renewal is not uniform and unpredictable • Long term availability • Efficient storage systems • Efficient distribution systems
http://oceanography.geol.uscb.edu/AWP/Class_Info/GS-4/a_s2003/QOTD/Precipitation.htmhttp://oceanography.geol.uscb.edu/AWP/Class_Info/GS-4/a_s2003/QOTD/Precipitation.htm
Evaporation Patterns • Returns water to atmosphere by evaporation or transpiration • Rate is dependent on weather conditions • Higher rates – greater solar radiation and winds, low humidity • Lower rates – temperature is lower • Rate of evapotranspiration • Worldwide – 62% • U.S. – 70% • Temperature and Evaporation • Return water to atmosphere • Cool the surface • Reduce availability of free water
Evaporation Patterns • Type and density of natural vegetation effects water availability • Areas of low rainfall – plants cover area and prevent stream flow • Evapotranspiration contributes to problems of surface water and soil quality in arid regions • High evaporation rates – loss of stored water • Evaporation of rivers and reservoirs • Deteriorate water quality from salt concentrations
Surface Water • Includes rivers and lakes • Presence indicates the precipitation exceeds evapotranspiration and groundwater seepage • Precipitation may be seasonal but can occur at anytime • Evaporation increases during summer • Water is important for population distribution, land use, and resource exploitation • U.S. divided into 18 Water Resource Regions for major surface water drainage systems • Western – water deficiency • Eastern – surplus
Groundwater • Near surface rocks and soils serve as storage sites • Water estimated 3000 times larger than volume of water in all rivers • 35 times the volume of all lakes and seas • Nonrenewable resource due to movement and recharge versus rate of withdrawal
Groundwater • Deep groundwater trapped and isolated in sediments • Shallow groundwater supplies depend on land slope, vegetation, soil depth, rock type, the amount of precipitation enters water table • Vadose unsaturated region of soil • Fills and drains quickly • Supplies most water for plants • Located above the water table
Groundwater • Vadose and soil water zones are essentail for replenishment of groundwater zones • During droughts water is lost through evaporation • Moisture moves upward • Aquifers • Geologic formations that allow the movement of water within • 50% of U.S. • Constant flow provides good quality water
Problems with Utilization • Rate of withdrawal and rate of recharge • 100 times the recharge rate • Extracted as nonrenewable resource • Causes land subsidence • Water quality • Movement of groundwater dissolves soluble constituents • Water with less than .05% is suitable for human consumption • Rapid water rate spreads contamination quicker than the water can be filtered or decomposed
http://water.usgs.gov/pubs/circ/circ1139/htdocs/natural_processes_of_ground.htmhttp://water.usgs.gov/pubs/circ/circ1139/htdocs/natural_processes_of_ground.htm
Ice Caps and Glaciers • 2.15% of total surface water • 70% of non saline water • Water is unavailable to humans • During last glacial ice age held 50% more water • Can drop sea level as much as 100 meter • Melting of ice causes sea level rise and effects coastal cities and agricultural land
Surface Runoff • Rainfall produces surface runoff • Function of amount of rainfall, slope and length of drainage basin, rock and soil type, vegetation cover, and extent of impermeable areas • Characterized by hydrograph • Quantity and time of rainfall • Smaller basins – min/hr • Larger basins – hr/day/wk • Used to predict water flow levels • Used to estimate flood conditions
Floods • Surface runoff exceeds normal stream capacity • Triggered by rainfall or melting of snow • Increased by mining, timbering, farming, and construction • Impermeable areas • Effected by soil permeability, duration and intensity of rain, and vegetation type • Energy of water causes damage to human structures
Map of flow and High Flood Conditions http://water.usgs.gov/cgi-bin/dailyMainW?state=us&map_type=flood&web_type=map
Flood Control • Dam – temporary water barrier • Dams Advantages • temporary water barriers for flood control • Water storage for irrigation • Electric power generation • Recreation – produces new lakes • Livestock watering • Enriches groundwater • Dam Disadvantages • Sediment catchment • Increases evaporation • Loss of inundated land • Interruption of river transport • Disruption of fish migration • Environmental alteration
Flood Control • Channelization – carries water out of an area to prevent flooding • Advantages • Allows water flow out of flood prone area • Increased water flow – straighter channel • Lowers water table and drainage of swamplands • Disadvantages • Increases erosion • Tranfers flooding • Reduces natural filtering of groundwater • Loss of wetlands • Reduces total biomass of river by 80%
Our Use of Water Carly Vaughn Kathryn Jones Clarissa Guzman
Water • Most widely used and most valuable resource • Amount consumed per capita varies from each countries standard of living
Water • Withdrawal – water physically extracted from its source • Consumption – withdrawn water no longer available because it has been evaporated, transpired, incorporated into crops and products or consumed by humans or livestock
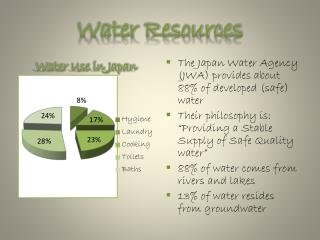
Water • The United States uses ¾ of water from surface sources • Nebraska, Kansas, and Arizona draw most of their water from underground sources • 1% is from private wells • California uses the most and Alaska uses the least • Avg person uses 6130 liters, 1620 gallons per day, if only domestic water is considered 400 liters 105 gallons
Water Usage and Consumption • Is divided into 4 Categories • Domestic – commercial • Industrial – mining • Thermoelectric power • Irrigation – livestock
Domestic and Commercial – Supplying Our Cities • Includes that needed by normal households and for the water for motels, hotels, restaurants, offices, stores, and businesses – and military and government use. • It is 11.5 % of total usage – 80% of this is returned to water systems usually by water – treatment plants • Most Major Cities – Modern and ancient are built near water – when this ran out it became necessary to find other sources of water
Aqueducts • Water transportation systems • Were probably stream channels that were altered so that they were in more accessible areas • Romans – built 9 major aqueducts brought 322 million liters of water to Rome daily • In New York City – present day – 15 reservoirs are linked containing 1860 x 109 490 x 109 gallons • There is a lot of rainfall in this area to supply enough water but other arid areas of the U.S. aren’t so lucky • In California there is a channel that is 1100 km 685 miles to bring water to Los Angeles
Used in areas with a large amount of farming but there is very little rainfall Water use for irrigation in the U.S. is 43%, it is 84% of water consumed It is 80 – 90 % in India and Mexico Eastern U.S. only uses 5% while Western U.S. uses 90 percent for irrigation Irrigation
Irrigation • Siphons – water irrigation system in which water is forced out by gravity and transported to other areas by large furrows and large walking systems • Irrigation can consume large amounts of water – Ogallala Aquifer 150,000 wells draw water from this source