Comparative Analysis of Linear Discriminant Function Models: Nested vs Non-Nested Approaches
This document delves into the methodologies for testing research hypotheses using Linear Discriminant Function (LDF) models, focusing on the comparison of nested and non-nested models. It discusses the three key model fit indices relevant to LDF, including likelihood ratios, R² values, and correct reclassification percentages. The nuances of conducting model comparisons through statistical tests such as the X² test and McNemar's test are explored. Examples illustrate testing scenarios in both concentrated and diffuse model structures, providing a comprehensive overview for researchers engaged in modeling techniques.

Comparative Analysis of Linear Discriminant Function Models: Nested vs Non-Nested Approaches
E N D
Presentation Transcript
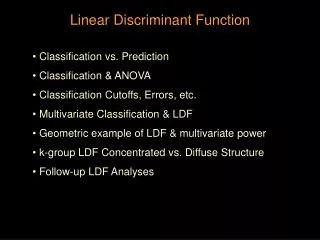
Testing Research Hypotheses using Linear Discriminant Function • Nested & non-nested model comparison • the 3 Model fit indices • Comparing Nested Models • Comparing Non-nested Models
As for multiple regression, nearly any research hypotheses can be assessed by the proper comparison of two ldf models • There are two types of model comparisons… • comparing nested models -- the smaller model involves discriminator variables that are a proper subset of those in the larger model • comparing non-nested models -- those models may be of the same or different numbers of discriminator variables • Unlike with multiple regression, there are three different indices of how well the data fit the model that might be used… • value (remember - smaller means model “works better”) • Rc -- basically the same index as used in multiple regression • % correct re-classification
Comparing Nested Models Starting with the simple case of 2-groups • comparing • since the models are nested, the X² values used to test the of the models are nested • nested X² values are tested by comparing the difference between the X² from the models to a X²-critical based on the difference between the df of the two models • e.g., the larger 8-var model has = .78, X² (8) = 12.2 the smaller 5-var model has = .89, X² (5) = 4.2 • To test the models X² = 12.2 - 4.2 = 8.0 • The X²-critical based on df = 8 - 5 = 3 is 7.815 • Since X² > X²-critical, we would conclude the larger model “does better”
comparing Rc • since the models are nested, the R² F-test can be used • ( RL² - RS² ) / ( kL - kS ) RL² - R² from larger mode F = ------------------------------- RS² - R² from smaller model ( 1 - RL² ) / ( N - kL-1) kL - # vars in larger model kS - # vars in smaller model N - number of cases • F is compared to F-critical based on df (kL - kS &N - kL -1)
comparing % correct re-classification • we expect that the larger model will have a higher %, but need to test if the difference is larger than would be expected by chance • However, often those folks who are mis-classified by the smaller model are often not a proper subset of those mis- classified by the larger model. • So, statistically the question becomes, “Are there fewer folks who are uniquely mis-classified by the larger model than there are those who are uniquely mis-classified by the smaller model?” • This conforms to the H0: tested by McNemar’s X² test. • There is a worked example on the ldf handout...
Comparing nested models from k-group designs… • this can get ugly quickly… • when there is a concentrated structure, you can use the same techniques as for a 2-group design (shown above) • when there is a diffuse structure (in one or both models), comparing values is of limited utility, since the difference between the models might be in the second ldf (while the 1st values from the two models are nested, the second values are not, and so the X² test won’t work) • when there is a diffuse structure, comparing the RC values has the same problem • however, the models can be directly and properly compared using the test of different % correct classification and McNemar’s X²
Comparing Non-nested ldf Models • For 2-group models and concentrated k-group models • The % correct classifications can be compared using McNemar’s X² • The RC from the two model can be compared using Hotelling’s t-test or the Meng and Rosenthal Z-test • For diffuse k-group models (one or both models are diffuse) • limited to the comparison of % reclassification and McNemar’s X² test