Comparing Fields: HWRF Analysis vs GFS Analysis in Large-Scale Weather Runs
440 likes | 550 Vues
This study compares fields obtained from two HWRF configurations: H14C with GSI used on Domain 1 and T14C without GSI on Domain 1, both using GFS analysis 0.5X0.5 grib2 data. The analysis covers 447 cycles in the Eastern Pacific and Atlantic regions in August 2012 and 2013. Various parameters like Geopotential Height (HGT), Temperature (TMP), Relative Humidity (RH), Specific Humidity (SPFH), Wind Speed, U, and V components at 850mb and 500mb levels are compared to identify biases and differences. The study explores why wind speed is close but wind components differ by examining specific cycles like Storm 04L 2013. Implications of differences in fields between HWRF and GFS analyses are discussed, focusing on discrepancies in temperature over land and spatial patterns of various variables. The study concludes with recommendations for improving the comparison and analysis process.

Comparing Fields: HWRF Analysis vs GFS Analysis in Large-Scale Weather Runs
E N D
Presentation Transcript
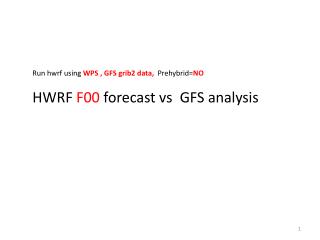
Comparing initial large-scale fields from two HWRF runs with GFS analysis --Two HWRF configurations ❶ H14C : GSI is used on Domain 1 ❷ T14C: GSI is not used Domain 1 --GFS analysis 0.5X0.5 grib2 data are used
H14C vs T14C From Mingjing Tong
Procedure Get data of both HWRF runs from hpss for all cycles in EPAC and ATL in Aug of 2012 and 2013. Total 447 cycles. 2. Use “copygb” to map HWRF domain 1 to the same grid of GFS data (0.5X0.5), hr_grid="255 0 720 361 90000 000000 136 -90000 -500 500 500 0" 3. Calculate bias ( mean differences (HWRF – GFS), RMS difference for a given point. SPFH not available in HWRF but available in GFS. Calculated both for consistent comparison.
Distribution of the number of available data points # of Cycles in Aug 2012: 296 = 77E + 219L # of Cycles in Aug 2013: 151 = 108E + 43L Total: 447
HWRF analysis vs GFS analysis • HGT (850mb, 500mb) • TMP (850mb, 500mb) • RH (850mb, 500mb) • SPFH (850mb, 500mb) • Wind speed (850mb, 500mb) • U (850mb, 500mb) • V (850mb, 500mb)
850mb H14C – GFS T14C – GFS BIAS RMS
500mb H14C - GFS T14C - GFS BIAS RMS
850mb H14C - GFS T14C - GFS BIAS RMS
500mb H14C - GFS T14C - GFS BIAS RMS
850mb H14C - GFS T14C - GFS BIAS RMS
500mb H14C - GFS T14C - GFS BIAS RMS
850mb H14C - GFS T14C - GFS BIAS RMS
500mb H14C - GFS T14C - GFS BIAS RMS
850mb H14C - GFS T14C - GFS BIAS RMS
500mb H14C - GFS T14C - GFS BIAS RMS
850mb H14C - GFS T14C - GFS BIAS RMS
500mb H14C - GFS T14C - GFS BIAS RMS
850mb H14C - GFS T14C - GFS BIAS RMS
500mb H14C - GFS T14C - GFS BIAS RMS
Why wind speed close, but wind components different ? - Select one cycle to take a closer look
T14C minus GFS analysis Storm 04L 2013 2013080118 cycle 850mb Scalars TMP HGT RH
Wind speed Wind Large differences appear on the left part of domain. V U
HWRF GFS analysis Implication: POST different or one has error WRFOUT netcdf
HWRF F72 vs GFS analysis • HGT (850mb) • TMP • RH • SPFH • Wind speed • U • V
850mb H14C - GFS T14C - GFS BIAS RMS
850mb H14C - GFS T14C - GFS BIAS RMS
850mb H14C - GFS T14C - GFS BIAS RMS
850mb H14C - GFS T14C - GFS BIAS RMS
850mb H14C - GFS T14C - GFS BIAS RMS
850mb H14C - GFS T14C - GFS BIAS RMS
850mb H14C - GFS T14C - GFS BIAS RMS
HWRF F72 vs GFS F72 • HGT (850mb) • TMP • RH • SPFH • Wind Speed • U • V
850mb H14C - GFS T14C - GFS BIAS RMS
850mb H14C - GFS T14C - GFS BIAS RMS
850mb H14C - GFS T14C - GFS BIAS RMS
850mb H14C - GFS T14C - GFS BIAS RMS
850mb H14C - GFS T14C - GFS BIAS RMS
850mb H14C - GFS T14C - GFS BIAS RMS
850mb H14C - GFS T14C - GFS BIAS RMS
Summary 1. HWRF analysis vs GFS analysis T14C (without GSI) is better than H14C (with GSI) in terms of scalar fields (HGT, TMP, RH, SPFH). U/V differences are large for both. POST is very likely the error source. 2. HWRF F72 vs GFS analysis Largest difference is temperature over land. Both colder/wetter than GFS analysis. Spatial patterns of other differences somewhat correlate with TMP. Difference between T14C and H14C after 72hr integration not obvious, with T14C slightly better. 3. HWRF F72 vs GFS F72 Very similar, except temperature over land. Seem that spatial patterns of other variables ~ tmp. Better LSM will make comparison better.
04L_2013080118 f00 RH H14C minus GFS analysis 850mb H14C TMP HGT TMP
Speed U V