Download
1 / 2
40 likes | 407 Vues
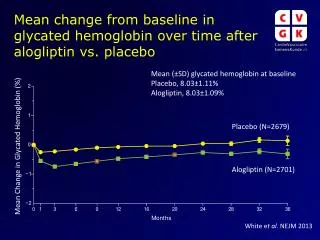
Mean change from baseline in glycated hemoglobin over time after alogliptin vs. placebo. Mean (±SD) glycated hemoglobin at baseline Placebo, 8.03±1.11% Alogliptin , 8.03±1.09%. Placebo (N=2679). Mean Change in Glycated Hemoglobin (%). Alogliptin (N=2701). White e t al. NEJM 2013.

E N D
Meanchangefrom baseline in glycatedhemoglobin over time afteralogliptinvs.placebo Mean (±SD) glycated hemoglobin at baseline Placebo, 8.03±1.11% Alogliptin, 8.03±1.09% Placebo (N=2679) Mean Change in Glycated Hemoglobin (%) Alogliptin (N=2701) White et al. NEJM 2013
Time to firstoccurrence of primaryendpointafteralogliptinvs. placebo Hazard ratio, 0.96 (upper boundary of the one-sided repeated CI, 1.16) 24 18 Cumulative Incidence of Primary End-Point Events (%) Placebo 12 Alogliptin 6 6 12 18 24 30 Months White et al. NEJM 2013