Download
1 / 16
160 likes | 347 Vues
A. Fabich, CERN MERIT collaboration meeting, CERN, 7-8 February 2008. MERIT beam intensities. Contents. Aim: Single bunch intensities Relative precision of a few percent Must be better than the aimed precision for detecting production deficiencies due to cavitation.

E N D
A. Fabich, CERN MERIT collaboration meeting, CERN, 7-8 February 2008 MERIT beam intensities A. Fabich, CERN
Contents Aim: • Single bunch intensities • Relative precision of a few percent • Must be better than the aimed precision for detecting production deficiencies due to cavitation. • Beam intensity monitors • Data synchronization • MERIT BCT data and analysis • PS transformer data • Self-contained analysis and comparison of different systems A. Fabich, CERN
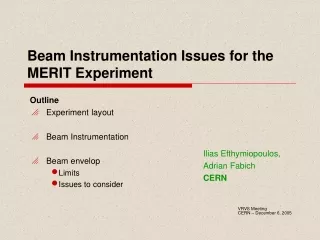
Beam intensity monitors • BSM • Bunch shape measurements in the PS ring • On last turn before extraction • Single bunch intensities available • Not always recorded, data stored graphically • BeamCurrentTransformers (PSCT) on TT2 • Pulse intensities measured, no single bunch intensities • “wrongly” measured intensities for pulses in pump-probe method beyond a certain delay • Automatic logging (data electronically available) • MERIT BCT on TT2A (MCT) • About 10 meter upstream of z=0 • Single bunch intensities available • 500 MHz (2 ns) sampling rate • Attenuation factor was increased once on 26.Oct 2008 at 16:03 (BCT time) • Automatic logging (data electronically available) A. Fabich, CERN
The crux of the matter is in the details .... which takes a long time to analyse ... A. Fabich, CERN
Step 1 – Synchronize data Sources with different data management and timing systems Ilias prepared a file with all major parameters combined with beam run numbers. • MERIT logbook and beam run numbers • PS logging system (PSCTs, B-fields ...) • UTC time (2 hour off, 1 hour off after 28th Oct. 2007) compared to CERN time GMT+1) • MERIT BCT, stand-alone server (with different day-light adjustments than usual) • Mercury system • Particle detector systems For the case of beam intensities: • Satisfactory! • Minor discrepancy, where the discrepancy has other origins than timing synchronization. A. Fabich, CERN
A typical MCT recording Bunch (h16) drift - offset Ringing A. Fabich, CERN
PS in different harmonic modes A. Fabich, CERN
Single pulse response All single h16-bunches • normalized to unity. • Time shifted Left: start of MCT response Center: ringing up to “next” bunch Right: Numerical integral A. Fabich, CERN
“Single” pulses – h8 A. Fabich, CERN
Analysis – step by step • Any beam taken (in fact 2007-10-31,10:00:52 transformer time) • harmonic 16 • 16 bunches • NO pump-probe; extraction within one turn Raw integral A. Fabich, CERN
Reconstruct with single pulse response(single pulse from 2007-10-29 16:20:51) A. Fabich, CERN
The intensity integral A. Fabich, CERN
Comparison PSCT - MCT • Right: • red and green = PSCT (scaled) • Black: ratio MCT/OSCT • Left: Histogram of black data from right • Peak at 1 is reasonable • Some strange peaks and flat distributions • Peak at 0.25 and 0.5 from “wrong” measurements by PSCT in pump-probe A. Fabich, CERN
BSM data • Right: BSM • Below: superposition of BSM and MCT A. Fabich, CERN
BSM summary • Pulse total from single bunch recordings of BSM and MCT are compared. • Poor statistics from BSM (to be verified). A. Fabich, CERN
Summary • Analyzed about 500 beam measurements • Revisit intensity from PSCT for “strange” cases • Codes (mathematica) available for automated analysis available • Summary sheet of all single bunch intensities available • Need to add flag of good/bad beams • If “bad” beam run is needed, has to be evaluated case-by-case. • Re-evaluate BSM data A. Fabich, CERN