Download
1 / 16
160 likes | 300 Vues
Explore the critical differences between actual and adjusted stock prices in this detailed overview. Actual prices reflect the closing value recorded on a specific date, while adjusted prices consider factors like dividends and stock splits to reflect the true value an investor would have experienced. Learn with real data cases, including Yahoo finance examples of IBM stock prices from 2012 and historical insights from 1962. Understand when to use adjusted data for deeper analysis and avoid potential pitfalls through effective data management for optimal investment decisions.

E N D
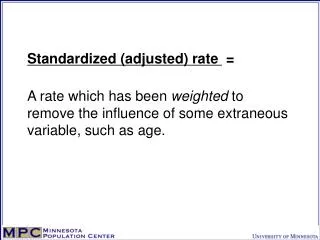
Actual versus Adjusted • Actual: The actual closing price recorded by the exchange on the specific date in history. • Adjusted: A revised price that automatically accounts for “how much you would have made if you held the stock.”
Example Yahoo Data: IBM Date,Open,High,Low,Close,Volume,Adj Close 2012-12-03,190.76,191.30,188.36,189.48,3349600,189.48 2012-11-30,191.75,192.00,189.50,190.07,4936400,190.07 2012-11-29,192.75,192.90,190.20,191.53,4077900,191.53 … 1962-01-08,559.50,559.50,545.00,549.50,544000,2.43 1962-01-05,570.50,570.50,559.00,560.00,363200,2.48 1962-01-04,577.00,577.00,571.00,571.25,256000,2.53 1962-01-03,572.00,577.00,572.00,577.00,288000,2.55 1962-01-02,578.50,578.50,572.00,572.00,387200,2.53
Gaps In Data (NaN) • Breaks in trading • Before stocks exist • After stocks exist
Summary • Know what your data is! • When use adjusted? • When use actual? • Fill forward, then fill back • Dangers of filling