Download
1 / 72
780 likes | 1.08k Vues
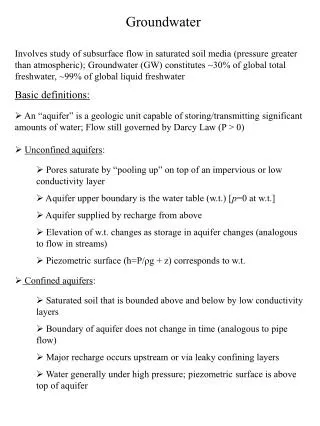
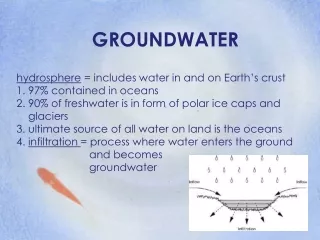
Groundwater Chemistry Evolution. Evolutionary sequence controlled by mineral identity, availability, and solubility High availability: carbonates and felsic minerals High solubility: gypsum/anhydrite, evaporites Deeper groundwater is a closed system with respect to gases

E N D
Groundwater Chemistry Evolution • Evolutionary sequence controlled by mineral identity, availability, and solubility • High availability: carbonates and felsic minerals • High solubility: gypsum/anhydrite, evaporites • Deeper groundwater is a closed system with respect to gases • Water is isolated from the atmosphere • If gases are consumed, their concentrations decrease; if generated, concentrations increase
Trends with age/depth • As groundwater migrates, concentration of TDS and most major ions increases • Anions • HCO3- HCO3- + SO42- SO42- + HCO3- SO42- + Cl-Cl- + SO42-Cl- • Cations • More difficult to generalize trends • Most common trend: Ca2+, then Ca-Na, Na-Ca, finally Na+ • Driven by cation exchange and CaCO3 precipitation
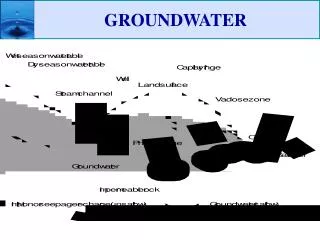
Evolution of Groundwater Chemistry Low TDS Intermediate TDS Aquitard: TDS high relative to aquifers High TDS
Water Chemistry: Information on Weathering Reactions • Knowing starting and ending solution chemistry of a system, we can infer what reactions have taken place to produce the ending solution • Reaction-Path Modeling • In addition to water chemistry, need information on minerals present • As groundwater migrates along a flow path, reactions occur: • Dissolution adds ions • Mineral precipitation removes ions • The change in water chemistry = the sum of all dissolution/precipitation reactions
Reaction Path Models • Good for simple systems where flowpaths are well defined • The larger and more complex the systems, the harder it is to constrain potential reactions • Can consider redox reactions, gas exchange, isotopic reactions, mixing of waters, etc. • N.B.: there is no unique solution • Modeler determines which phases to consider • Based on available data and “intuition”
Redox reactions in Groundwater • Redox reactions are extremely important in groundwater and soil water • Water tends to become more reducing as it moves along a flow path • Almost all redox reactions in groundwater are biogeochemically mediated • DO typically consumed in the soil zone and shallow groundwater, resulting in anoxic groundwater
Groundwater Chemistry: Redox Evolution • After DO is consumed, other TEAPs are used by microbes based on thermodynamics • NO3- reduction (denitrification) • MnO2 [Mn(IV)] reduction • Ferric [Fe(III)] mineral reduction • SO42- reduction • Fermentation and methanogenesis (CO2 reduction) • “Redox ladder” • The order of the reactions based on obtainable energy for the microbes • Kinetics: the less the energy, the slower the reaction
Organic Matter Oxidation • Aerobic • CH2O + O2 CO2 + H2O • Denitrification • 5 CH2O + 4 NO3- + 4 H+ 5 CO2 + 2 N2 + 7 H2O • Ferric iron [Fe(III)] reduction • CH2O + 4Fe(OH)3 + 8 H+ CO2 + 4 Fe2+ + 11 H2O • Sulfate reduction • 2CH2O + SO42- + H+ 2 CO2 + HS- + 2 H2O
Fermentation and Methanogenesis • Reactions that occur when all external electron acceptors have been used; methane (CH4) is produced, CO2 both produced and consumed • Transformation of complex organics into simpler compounds • Fermentation: • CH3COOH CH4 + CO2 • CH3COOH = Acetic acid • Also produces H2 • CO2 + H2O HCO3- + H+ • 2 H+ + 2 e- H2 • Fermentation byproducts are used by methanogenic microbes
Fermentation and Methanogenesis • Methanogenesis: CO2 + 4 H2 CH4 + 2 H2O • Methanogens need fermenters • H2 is a reactive intermediate product, produced and consumed by metabolic processes • Low at high Eh, higher at lower Eh • H2 is best indicator of dominant TEAP, but difficult to measure (field GC)
Use of H2 to delineate redox processes • Chapelle et al. (1996) • Hypothesis: • Fermentative microbes continually produce H2 • Fe(III), SO42-, and CO2 reducing microbes use H2 as TEAP at different efficiencies • Fe(III) reduction: 0.2 – 0.8 nM • SO42- reduction: 1 – 4 nM • CO2 reduction (methanogenesis): 5 – 15 nM
TEAPs in Groundwater Contaminated Uncontaminated FLOW
TEAPs • While thermodynamics predicts an orderly progression of the dominance of individual TEAPs, it’s not so simple in nature • Often have 2 (or more) TEAPs active in same part of aquifer • e.g., often have Fe(III)-reduction and SO42--reduction occurring together, even though Fe(III)-reduction more thermodynamically favorable • Due to: micro-environments, different microorganisms responsible, solid vs. aqueous environments • Where there’s energy to be gained, microbes are working
Defining Redox Zones From McMahon, P.B. and F.H. Chapelle. 2008. Redox processes and water quality of selected principal aquifer systems. Ground Water 46(2):259-71.
McMahon, P.B., and F.H. Chapelle. 2007. Redox Processes and Water Quality of Selected Principal Aquifer Systems. Ground Water 46:259–271
Redox Conditions in Aquifers • Shallow groundwater usually low but detectable DO • Most deeper aquifers are anoxic • Key variables: • Organic matter • Hydraulic conductivity • Mineralogy • Recharge rates (climate) • Most aquifers have a dominant TEAP, but most (if not all) TEAPs active
Redox Buffering • Observation: the Eh of groundwater does not linearly decline as oxidizers are consumed along a flow path • The Eh remains relatively constant as a particular oxidizer is consumed, then the Eh drops and stabilizes again • Similar to pH buffering in that a reaction is preventing a rapid change even though e- (vs. H+) are being produced/consumed • For pH buffers, occurs around pKa of conjugate acid/base pair (e.g., 6.35 for H2CO3/HCO3-) • For Eh buffers, occurs around E°
Redox Buffering • System is buffered if oxidizable or reducible compounds are present that prevent a significant change in Eh when strong oxidizing/reducing agents added • Expect Eh of natural waters to generally be in buffered ranges • Values in unbuffered ranges unstable
Computed vs. Measured Field Eh - Vertical bands indicate buffered ranges; reflect the standard E°
Redox Buffering • Example: recharging water has dissolved O2, Eh will remain high until O2 is consumed; after O2 gone, Eh drops rapidly and stabilizes at the value determined by next oxidizer • Buffers can be dissolved species or solid matter • Dissolved species: usually limited in concentration and consumed rapidly (if right conditions exist) • Solid matter: can provide large buffering capacity • e.g., Fe(OH)3 can provide buffering until equilibrium is reached with dissolved Fe concentration
Evaluating Water Chemistry Data • When we collect a sample, we trust that the lab analyzes and reports the results correctly • Need to do appropriate field and lab QA/QC (more on this later) • One test of analytical integrity is the charge balance error (CBE)
Charge Balance Error (CBE) • Based on the concept all ions in water are charge balanced, i.e., Σanions = Σcations • Calculate using equivalents (molarity x charge) • Can use all ions, but often only major ions considered • A positive value = excess of cations • A negative value = excess of anions • A value < 5% is usually considered adequate
Charge Balance Errors When you get a water sample composition, the first thing you should do is calculate the CBE (assuming it’s a complete analysis)
Graphical Data Analysis • Graphs are essential for two purposes: • To provide insight into the data under scrutiny • To illustrate important concepts when presenting results • Graphing should be done before any other analysis • See patterns • Guide further analysis
Graphs useful for Water Quality Data • Histograms • Scatterplots • Box and whisker plots • Piper diagrams • Stiff diagrams
Histograms • Bars drawn to indicate number of samples in a certain interval • Visual impression depends on number of intervals
Histograms • For sample size of n, number of intervals (k) should be the smallest integer for 2k ≥ n • So for n = 100, k = 7 (27 = 128)
Histograms • Not best for data measured on continuous scale (such as concentration) • Best when displaying data which have natural categories or groupings • e.g., number of wells contaminated with bacteria based on land use or rock type
Scatterplots (x-y plots) • Very common, easily made • Illustrates the relationships between 2 (or more) variables • Can perform linear regressions
Boxplots • Boxplots provide a visual summary of: • The center of the data (the median – the center line of the box) • The variation or spread (interquartile range – the box height) • The skewness (quartile skew – the relative size of box halves) • Presence or absence of unusual values ("outside" and "far outside" values) • Can easily compare more than one dataset
Box Plots 10 Concentration IQR 0
Making Box Plots: calcium data Outliers Outliers 75th 10th 25th Median 90th Whiskers Box