Download
1 / 79
800 likes | 1.21k Vues
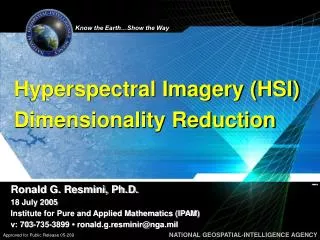
Hyperspectral Imagery (HSI) Dimensionality Reduction. Ronald G. Resmini, Ph.D. 18 July 2005 Institute for Pure and Applied Mathematics (IPAM) v: 703-735-3899 • ronald.g.resminir@nga.mil. Outline. Introduction to HSI HSI Dimensionality HSI Dimensionality Reduction (DR)

E N D
Hyperspectral Imagery (HSI)Dimensionality Reduction Ronald G. Resmini, Ph.D. 18 July 2005 Institute for Pure and Applied Mathematics (IPAM) v: 703-735-3899 • ronald.g.resminir@nga.mil
Outline • Introduction to HSI • HSI Dimensionality • HSI Dimensionality Reduction (DR) • Do We Need DR? • HSI Algorithms • What Can You Do? How Should You Do It?
Introduction to Hyperspectral Imagery (HSI) Remote Sensing HSI is, fundamentally: SPECTROSCOPY writ large...the phenomenology of spectra; remote material detection, identification, characterization and quantification
HSI Remote Sensing: Frame of Reference... • Remote sensing of the earth • airborne • spaceborne • ground (portables) • But bear in mind other apps: • medical • industrial • many, many others
Reflected Energy Emitted Energy MWIR SWIR NIR B G R LWIR LWIR Wavelength (nm) (m) 5000 5.0 14000 14.0 700 0.7 1500 1.5 400 0.4 3000 3.0 Electromagnetic EnergyElectromagnetic Spectrum Electromagnetic Spectrum V / NIR / SWIR / MWIR / LWIR Optical Region Shorter Wavelengths High Energy Longer Wavelengths Low Energy X Rays Cosmic Rays Microwaves (Radar) Radio & Television Waves Gamma Rays UV Wavelength(nm) 108 109 101 1010 1011 10-2 10-1 105 106 107 1012 10-5 10-4 10-3 10 400 14000
Reflected vs. Emitted Energy MWIR 104 1000 Earth Reflectance (100%) Earth Emission (100%) 100 Irradiance (W-m-2-um-1) radiant exitance (W-m-2-um-1) 10 Assumes no atmosphere 1 .4 0.1 .7 1 5 7 10 3 Wavelength (µm)
MED Multispectral: several to tens of bands Sampling the Spectrum NIR SWIR MWIR LWIR B R G 400 nm700 1500 3000 5000 14000 nm Panchromatic: one very wide band LOW Hyperspectral:hundreds of narrow bands HIGH
Interaction of energy and objects Emitted Energy MW-LWIR Reflected Energy V-MWIR Incident Energy Absorbed Energy Transmitted Energy Energy Balance Equation:EI () = ER() + EA() + ET()
Applications of HSI RS • Geology • Forestry • Agriculture • Mapping/land use, land cover analysis • Atmospheric analysis • Environmental monitoring • Littoral zone RS • Many, many others
Levels of Spectral Information Quantification:Determines the abundance of materials. Characterization: Determines variability of identified material (e.g. wet/dry sand, soil particle size effects). Identification:Determines the unique identity of the foregoing generic categories (i.e. material identification). Discrimination:Determines generic categories of the foregoing classes. Classification:Separates materials into spectrally similar groups. Detection:Determines the presence of materials, objects, activities, or events. High Spectral Resolution Hyperspectral (100’s of bands) Multispectral (10’s of bands) Panchromatic Low Spectral Resolution
Image from the NASA Langley Research Center, Atmospheric Sciences Division. http://asd-www.larc.nasa.gov/erbe/ASDerbe.html
Reflectance:Is the ratio of reflected energy to incident energy. Varies with wavelength Function of the molecular properties of the material. Reflectance Signature:A plot of the reflectance of a material as a function of wavelength. Red brick Kaolinite Sandy loam Concrete Grass Reflected Energy All solids and liquids have reflectance signatures that potentially can be used to identify them.
Blackbody – A theoretical material that absorbs and radiates 100% of the energy incident upon it. BB curve is a function of temperature and wavelength. Planck’s Law – gives shape of blackbody curve at a specific temperature. Wien’s Displacement Law– determines wavelength of peak emittance. Peak Emittance 6000K Sun 373K Boiling Water 1500K Hot Coals 3000K Light Bulb Spectral Radiant Emittance 800K 500K 250K 300K Ambient 0.2 0.4 0.7 1 2 3 5 8 10 30 Wavelength (µm) Emissive EnergyBasic Concepts
Units: The Planck or Blackbody Radiation Equation:
Emissivity -is a measure of how efficiently an object radiates energy compared to a blackbody at the same temperature. Varies with wavelength Function of the molecular properties of the material. Emissivity Signature - A plot of emissivity as a function of wavelength. All materials have emissivity signatures that potentially can be used to identify them. Blackbody 1.0 Graybody 0.5 Emissivity Red brickKaolinite Grass Water Black paint Concrete Selective emitter (emissivity signature) 0 Wavelength Emissive Energy
Spectral Signature Libraries (...beyond scope for a discussion on DR; but...) • Spectral signatures of thousands of materials (solid, liquid, gas) have been measured in the laboratory and gathered into “libraries”. • Library signatures are used as the basis for identification of materials in HSI data.
Understanding Spectral Data: Signature Variability Factors • Composition • original • change over time • Surface quality • roughness • weathering • Shade & Shadow • Temperature • Brightness • BRDF • Target morphology • shape • orientation • Particle size • Moisture • Spectral mixing
The manner in which a material reflects energy is primarily a function of the optical properties and surface roughness of the feature. Most objects are diffuse reflectors Reflected Energy Angle of Incidence = Angle of Reflectance Energy Scattered in All Directions Smooth Surface Rough Surface (Microscopic) Specular Reflectance Diffuse Reflectance
Emission Absorption No Detection Detected Signature Wavelength Wavelength Wavelength Gas Plume Gas (Cool) Gas (Warm) Same Temperature Background (Cool) Background (Warm) Background Emissive EnergyIdentification of Gases Gases appear in either emission or absorption depending on the temperature contrast between the gas and the background.
...from Welty, Wicks, and Wilson (1984) Stefan-Boltzmann Law: Two surfaces radiating at each other: View Factor Algebra and Radiant Exchange...
‘Mixture’ = 25%A + 35%B + 40%C Spectral Mixture Analysis (SMA) • An area of ground of, say 1.5 m by 1.5 m may contain 3 materials: A, B, and C. • An HSI sensor with a GSD of 1.5 m would measure the ‘Mixture’ spectrum • SMA is an inversion technique to determine the quantities of A, B, and Cin the ‘Mixture’ spectrum • SMA is physically-based on the spectral interaction of photons of light and matter • SMA is in widespread use today in all sectors utilizing spectral remote sensing • Variations include different constraints on the inversion; linear SMA; nonlinear SMA
Resolutions (...beyond scope for a discussion on DR; but...) • Spatial Resolution • Radiometric Resolution • Temporal Resolution
Hyperspectral remote sensing involves measuring energy in the Visible – LWIR portions of the electromagnetic spectrum. Some of the measured energy is reflected from objects while some energy is emitted from objects. Every material has a unique spectral signature. Spectral image data are collected such that signatures can be extracted for material detection,classification, identification, characterization, and quantification. Spectral, spatial, radiometric, andtemporal resolution determine the capabilities of the remote sensing sensor/system. HSI Fundamentals Summary
DN Calibration Fixes/Corrections Data Ingest Look At/Inspect the Data!! Atmospheric Compensation Algorithms for Information Extraction The General Data Analysis/Exploitation Flow Spectral Library Access Information Fusion Iteration Geometric/Geospatial Product/Report Generation Distribution Archive/Dissemination Planning for Additional Collections DR? Approved for Public Release 05-269
HSI Remote Sensing: Frame of Reference... • A Scientist’s Approach to the Data: • look at the data(!) • observables have a physical,chemical, biological, etc. basis • must understand nature of observables • bumps and wiggles have real,physical (spectroscopic) significance • application of tools comes last!
Defining HSI Dimensionality • Hundreds of bands of data in an HSI data cube • An HSI pixel (a spectrum) is an n-D vector • n = number of bands • a spectrum is a point in an n-D space • “Redundancy” of information • Embedding or spanning dimension • Intrinsic dimension/virtual dimension • A distinction • large volume of data • dimensionality
Reflectivity, r Wavelength (mm) The n-D Space — Where Many Algorithms Operate Each HSI spectrum (or pixel) is an n-D vector that can be represented as a single point in n-D space. n-D space is actually where many of our algorithms operate.
A B C D ...imagine an n-D hyperspace... r, Band b Spectrum s1 Reflectance, r r, Band a Wavelength (micrometers) Four (A-D) Equivalent Notations/Representations (0.11, 0.23, 0.30, 0.25, 0.16, 0.27, 0.31, 0.37,...,)
Some HSI Scatter Plots; Spectra as Points in ‘Hyperspace’
Defining HSI Dimensionality • “Curse of dimensionality” • for Gaussian distribution... • ...for a given classification accuracy • # of training samples grows quadratically • based on exploitation methodology; e.g.: Mahalanobis Distance: Maximum Likelihood:
HSI or MSI • 100’s of bands vs. 10’s of bands • Maybe all you need is 6 bands but... • you need six; and you need six; and so on • Atmospheric compensation... • HSI is spectroscopy writ large • its about resolving spectral information • fine spectral features • broad spectral features • Today’s FPAs make HSI a breeze anyway...
Multispectral - Hyperspectral Signature Comparison Multispectral Hyperspectral Resampled to Landsat TM7 Bands
SWIR NIR B G R Atmos. Comp. Minerals/Geology Iron oxides Fuels Aerosols O2 CO2 Chlorophyll Paints DOM/CDOM Cirrus Fabrics Vegetation Soils Plastics Bathymetry Wavelength (nm) (m) 700 0.70 1500 1.50 400 0.40 3000 3.00 Similar figures may be constructed for M/LWIR regions.
Estimating HSI Dimensionality • Eigenvalues of the covariance • principal components analysis (PCA)/aka KL • optimal, least squares sense • Eigenvalues of the correlation matrix • Visual—based on eigenvalues • Continuous significant linear dimensionality • CSD; eigenvalues (next slide...) Umaña-Díaz, A., and Vélez-Reyes, M., (2003). Determining the dimensionality of hyperspectral imagery for unsupervised band selection. Proceedings of the SPIE, S.S Shen and P.E. Lewis, eds., v. 5093, pp. 70-81. (...and references cited therein.)
Covariance Matrix: Find the eigenvalues of the covariance(or correlation) matrix and then... or: where: li are the eigenvalues
Virginia City Probe-1 HSI Data Eigenvalues from a PCA Eigenvalue Band Number 116 bands out of 128
Urban Scene HYDICE HSI Data Eigenvalues from a PCA Eigenvalue Band Number 162 bands out of 210
Mormon Mesa SEBASS HSI Data Eigenvalues from a PCA Eigenvalue Band Number 128 bands out of 128
Estimating HSI Dimensionality • Wavelet basis • Nonlinear dimension estimation • Near neighbor method of Pettis • Fukunaga and Olsen’s KL-related method • Fractal dimension • Hausdorff dimension • Box-counting method • Correlation integral/dimension (next slide...)
Box Counting: Correlation Dimension: Correlation Function: where: r is box size (DB) or radius of a hypersphere (D)
HSI Dimensionality Reduction • Techniques • Principal components analysis (PCA) • Minimum noise fraction (MNF) • Vector quantization (VQ) • Projection pursuit (PP) • The universe of data compression • lossless/lossy (when/why?) • discrete cosine transformation (DCT) • wavelets-based compression • Best bands selection/band averaging
Best-Bands Selection 2.0 mm to 2.5 mm – SWIR, Only
Other Means of DR • Spectral mixture analysis (SMA) • basis vectors • Analysis of filter vectors (OSP algorithms...) • Wavelet-based feature selection • On-board processing • transmit product • advanced computation • quantum computation?
Other Means of DR • Transmit only bands of interest • best-bands selection/band averaging... • ...perhaps after atmos. comp. • Spectral parameterizations • Derivative spectroscopy • Binary encoding
Spectral Parameterization: Spectral Metrics (1 of 2) Soil Spectrum
Desert Soil (Malpais) 0.12 0.10 0.08 Disturbed Soil 3.5 - 4.17 microns Band 1 Depth 0.06 Pristine Soil Vehicle Treads 0.04 0.02 0.00 0.00 0.10 0.20 0.30 0.40 0.50 3.5 - 4.17 microns Band 2 FWHM Spectral Parameterization: Spectral Metrics (2 of 2)