Self-funding Workers’ Compensation Exposures
170 likes | 326 Vues
Self-funding Workers’ Compensation Exposures. What your MAMA never told you…. Excess W/C Coverage. How does it work?. Excess W/C Declarations. Excess Workers’ Compensation Coverage ….(how does it work?). Excess. Excess Aggregate Max Limit. Excess. Specific Limit Per Claim “Statutory”.

Self-funding Workers’ Compensation Exposures
E N D
Presentation Transcript
Self-funding Workers’ Compensation Exposures What your MAMA never told you…
Excess W/C Coverage How does it work?
Excess Workers’ Compensation Coverage….(how does it work?) Excess Excess Aggregate Max Limit Excess Specific Limit Per Claim “Statutory” Retention Retention Retention Retention Retention Retention Specific Retention Per Claim $1,000,000 Retention Aggregate Retention is the sum of all retention in a fund year or the “loss fund” $1,672,162 $300,000 $300,000 $300,000 $300,000 $300,000 $172,162 $300,000
A little Missourian never hurts…… “Show Me”
Vendors are Vendors • TPA’s • Brokers • Actuaries • CPA’s • Financial Experts • You pay them for a service, be careful to accept praise without sufficient proof • Know your business better than they do. • Have them prove their praise via bench marks, true comparative analysis, good solid data.
Groups Premium to Surplus At least 1:1 Combined Ratio <100% Losses + IBNR + ULAE Premium Expense Ratio <25% Commercial Companies 28-32% Rate/$100 payroll How do you measure rate achievement (+ or -) Individuals Frequency Comparative analysis to like entities Experience Mod Closed claim cost comparison What Ratios or Metrics Matter?
Individuals • How are you funding losses • Dedicated Trust Fund? • Balance Sheet? “Accrued Liability” • Balance Sheet protection is paramount • e.g. Aggregate Excess • A dedicated fund for W/C exposures is very important, especially as we approach a transitioning market.
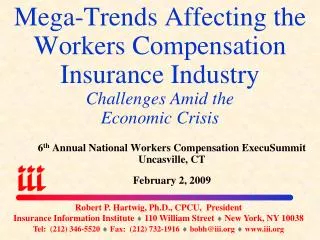
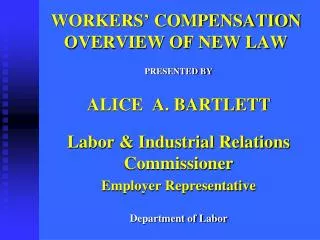
National Data Insurance Information Institute Robert P. Hartwig, Ph.D., CPCU, President & Economist Insurance Information Institute 110 William Street New York, NY 10038 Tel: 212.346.5520 Cell: 917.453.1885 bobh@iii.org www.iii.org
Frequency: 1926–2008A Long-Term Drift Downward Manufacturing – Total Recordable CasesRate of Injury and Illness Cases per 100 Full-Time Workers Note: Recessions indicated by gray bars. Sources: NCCI from US Bureau of Labor Statistics; National Bureau of Economic Research 10 12/01/09 - 9pm eSlide – P6466 – The Financial Crisis and the Future of the P/C
Workers Comp Medical Claim Costs Continue to Rise Medical Claim Cost ($000s) Annual Change 1991–1993: +1.9% Annual Change 1994–2001: +8.9% Annual Change 2002-2009: +6.6% Cumulative Change = 224% (1993-2009p) Accident Year 2009p: Preliminary based on data valued as of 12/31/2009 1991-2008: Based on data through 12/31/2008, developed to ultimate Based on the states where NCCI provides ratemaking services; Excludes the effects of deductible policies
Workers Comp Indemnity Claim Costs Continue to Grow Indemnity Claim Cost ($ 000s) Annual Change 1991–1993: -1.7% Annual Change 1994–2001: +7.3% Annual Change 2002–2008: +4.0% +4.5 +5.8 Accident Year 2009p: Preliminary based on data valued as of 12/31/2009 1991–2008: Based on data through 12/31/2008, developed to ultimate Based on the states where NCCI provides ratemaking services Excludes the effects of deductible policies
Med Costs Share of Total Costs is Increasing Steadily 2009p 1999 1989 Source: NCCI (based on states where NCCI provides ratemaking services).
Historically, Hard Markets FollowWhen Surplus “Growth” is Negative* (Percent) Surplus growth is now positive but premiums continue to fall, a departure from the historical pattern Sharp Decline in Capacity is a Necessary butNot Sufficient Condition for a True Hard Market * 2010 NWP and Surplus figures are % changes as of H1:10 vs H1:09. Sources: A.M. Best, ISO, Insurance Information Institute 14 12/01/09 - 9pm eSlide – P6466 – The Financial Crisis and the Future of the P/C
Soft Market Appears to Persist in 2010 but May Be Easing: Relief in 2011? (Percent) 1975-78 1984-87 2000-03 Net Written Premiums Fell 0.7% in 2007 (First Decline Since 1943) by 2.0% in 2008, and 4.2% in 2009, the First 3-Year Decline Since 1930-33. NWP was flat with 0.0% growth in 10:H1 vs. -4.4% in 09:H1 Shaded areas denote “hard market” periods Sources: A.M. Best (historical and forecast), ISO, Insurance Information Institute. 15 12/01/09 - 9pm eSlide – P6466 – The Financial Crisis and the Future of the P/C
Workers Compensation Combined Ratio: 1973–2012P Workers Comp Underwriting Results Are Deteriorating Markedly Sources: A.M. Best; Insurance Information Institute.
On the HorizonWhat does the future hold? • As in all things, the economy is cyclical • When the economy begins to grow you will experience an increase in: • Personnel • Payroll • Frequency of claims • Higher medical costs • Higher loss wages • Greater severity …………………. All of these will be the result of good things happening in the economy. Be prepared!