Download
1 / 33
340 likes | 754 Vues
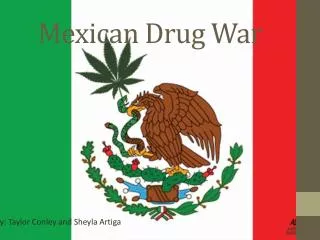
A GIS Analysis of the Mexican Drug War. Will Gilrain. Background. Drug war started in 2006 when Mexican President Felipe Calderon declared war on the drug cartels Between December 2006 and January 2011 at least 30,196 people were killed as a result of the drug war

E N D
A GIS Analysis of the Mexican Drug War Will Gilrain
Background • Drug war started in 2006 when Mexican President Felipe Calderon declared war on the drug cartels • Between December 2006 and January 2011 at least 30,196 people were killed as a result of the drug war • 12,456 died between January and November of 2010
Reasons for participating • Sometimes the only source of income for people, especially in rural areas • Many alluring factors to people with little to no money and very little education • Income provided by growing marijuana and poppies is much higher than other crops or sources of income • The smugglers pay the peasants in illegal drug production much better than legitimate agriculture • Cartels pay Urban youth 10-12 thousand pesos per month and train them in the use of violence to protect their business • Lack of education The people employed by the drug industry include chemists, lawyers, managers of laboratories, merchants, and transporters Sabet, K., and Rios, V. (2008). Evaluating the Economic Impact of Drug Traffic in Mexico. Harvard University, Department of Government.
Benefits • Rural areas • A few industries benefit from the drug production and violence • Construction • Vehicle armoring • Cartel leaders enjoy building churches and extravagant mansions • Has generated economic benefits for some local construction businesses and suppliers of construction materials • Armored car industry has seen an increase since the start of the drug war • $80,000 to $100,000 • Includes bulletproof glass, armor plates, tires that still operate when flat, and James Bond-style gadgets such as electrified door handles and push-button smokescreens • In the past only people of very high prominence had their cars armored but now it is becoming more commonplace
Impacts • Tourist industry • Taxi drivers targeted • Serve as eyes and ears on the street for cartels • In the run-up to most major cartel battles, each side tries to “blind” the other by reducing their surveillance assets • Cruise lines removing ships from Mexican area • Affects both Mexico and US cities • Multinational corporations growing uneasy • Not looking to open new businesses in Mexico • Looking at other places to shift operations to in case the situation in Mexico reaches a crisis • Cost of production increasing due to increased security costs • Local businesses • Some 10,000 businesses have shut down in the past 18 months in Juarez alone • Cities losing revenue • Monterrey (Mexico’s wealthiest city) • Juarez (Deadliest city in Mexico) • Over 3,000 drug war related deaths in 2010 • People are afraid to go out at night which hurts businesses
Effects • Violence • In Sinaloa, around 360,000 people have left the region due to fear of violence • Total economic losses due to violence are 12.3% of the total Mexican GDP • Corruption • Because Mexico is seen as corrupt, companies do not want to invest in it • This translates into losses that go from 0.01 to 1.66 billion dollars annually • More criminal activity • Free press is restricted • Government productivity decreases • Drug addiction • From 1988 to 2002 cocaine consumption increased roughly 375% • Direct economic costs in terms of productivity and human capital losses • Health care (both treatment and prevention) • Government expenditure (policies to prevent or treat drug consumption)
What can be done? • Currently the United States and Mexico employ a supply-side drug policy • Supplies cannot be cut off at the source and supply-side drug policy creates higher prices which leads to more crime • Policies that slash demand result in lower quantities and lower prices • With quantity and price both down, total revenue and the associated crime, should drop as well • Provide education and job opportunities as well as training for entrepreneurs for would-be drug dealers • Starting programs and support for self-employment can be a highly successful mechanism and relatively easy to do
The GIS • Methods • Techniques • Data Used • End Products
Methods • Conduct research and collect data • Reading articles, intelligence resources, searching for data • Create GIS using ESRI’s ArcMap software • Performed spatial analyses such as density analyses and interpolation • Combine multiple layers in order to analyze the information and compare crime to different factors
GIS Techniques • Heads up digitizing • Cartographic modeling • Address geocoding • Data compilation and management
Data Used • Place names for geocoding • Population • Cities • Agricultural area 2005 • Schools 2009 • Electricity usage 2009 • GDP 2009 • Lack of vegetation 2005 • Cartel influence areas • Major drug trafficking routes • Drug war murders by city December 2006 to December 2010
Spatial Analysis • Inverse Distance Weighted interpolation of murders by city • Chosen because the farther away a location is on the map from a city, the less influence that city has on the number of murders at that location. • Creates a raster that gives a value for the likely number of murders for every point in Mexico not just at the specific cities • Fuzzy membership • Correlation between the different attributes and the number of deaths defined by the IDW interpolation was shown by the fuzzy membership with darker hues marking higher correlation and lighter ones marking little to no correlation • Can be deceiving though because it just compares high values to other high values so for comparisons such as schools to murders where low schools might have higher murders the interpretation can be thrown off
End Products • GIS based on input data and methods applied • Online GIS prototype using ESRI’s ArcGIS.com • Hardcopy maps showing crime compared to different factors
Conclusions • Overall this project has a lot of potential uses. It could be used by the general public or multiple agencies such as the Mexican or United States governments. There are still more analyses that could be performed and the online map could be added to quite a lot. • These maps show some areas that the government could focus on in the war against the drug cartels, and some factors that could influence the amount of violence that could be focused on as well. Lack of vegetation, schools, and GDP seem to be the biggest factors to focus on since they had the most correlation.
Sources • Associated Press (AP). (2009, March 4). Armor-plated Vehicles Rise as U.S.-Mexico Border Violence Escalates. The Associated Press. • Associated Press (AP). (2010, December 15). Ciudad Juarez Drug War Death Toll Hits 3,000. Associated Press. • Billeaud, J. and Mendoza, M. (2009, December 17). Mexican Drug War Money Sliding Through Cracks of Border Crackdown. San Diego News Network. • Branas, C. C., Cheney, R. A., MacDonald, J. M., Tam, V. W., Jackson, T. D., & Ten Have, T. R. (2011). A Difference-in-Differences Analysis of Health, Safety, and Greening Vacant Urban Space. American Journal of Epidemiology, http://aje.oxfordjournals.org/content/early/2011/11/11/aje.kwr273.full?keytype=ref&ijkey=9pNc5FdhqLOAvbU. • Campbell, Monica. (2008, November 29). Bloodshed on the Border. Newsweek. • Duff, D., and Rygler, J. (2011, January 26). Drug Trafficking, Violence and Mexico's Economic Future. Wharton University of Pennsylvania. • ESRI. (2011). How Fuzzy Membership Works. Retrieved April 10, 2012, from ArcGIS Resource Center Desktop 10: http://help.arcgis.com/en/arcgisdesktop/10.0/help/index.html#/How_Fuzzy_Membership_works/009z000000rz000000/ • ESRI. (2011). How IDW Works. Retrieved April 10, 2012, from ArcGIS Resource Center Desktop 10: http://help.arcgis.com/en/arcgisdesktop/10.0/help/index.html#/How_IDW_works/009z00000075000000/ • Fairlie, Robert W. 2002. “Drug Dealing and Legitimate Self-Employment”. Journal of Labor Economics. 20(3). • Grant, R. (2008, June 4). Mexico's War on Drugs: Journey Into a Lawless Land. The Independent. • International Institute for Strategic Studies (IISS). (2007). The Military Balance 2007. IISS/Routledge Taylor and Francis Group. London. • Knowledge@Wharton. (2010, September 15). Mexico’s Drug War: The Battle to Remain Safe, Low-Cost, and Competitive. Wharton University of Pennsylvania. • Lee, III W. Rensselaer. (1989). The White Labyrinth. Cocaine and political power. New Brunswick.
Sources cont. • Llana, S. M. (2010, March 15). Mexico Killings: How the Drug War Crippled the Juarez Economy. The Christian Science Monitor. • National Drug Intelligence Center. (2008). National Drug Threat Assessment 2009. U.S. Department of Justice. • Office of National Drug Control Policy (ONDCP). (1998). Economic and Social Consequences of Drug Abuse and Illicit Trafficking. Technical Series Number 6. • Ramstack, T. (2011, January 10). Drug Cartel Murders Hurting Acapulco's Tourist Industry. All Headline News. • Rios, V. (2008). Who Becomes a Drug Dealer and Why? Harvard University, Department of Government. • Sabet, K., and Rios, V. (2008). Evaluating the Economic Impact of Drug Traffic in Mexico. Harvard University, Department of Government. • Stewart, S. (2011, Februrary 10). Mexico's Gun Supply and the 90 Percent Myth. Stratfor Global Intelligence. • Stonebraker, Robert J. (2010, August 18). Supply-Side Drug Policy: Will it Ever Work? The Joy of Economics: Making Sense out of Life, Winthrop University. • Stratfor Global Intelligence (Stratfor). (2005, August 2). Chaos on the U.S.-Mexican Border: Opportunity for Al Qaeda?Stratfor Global Intelligence. • Stratfor Global Intelligence (Stratfor). (2010, December 20). Mexican Drug Wars: Bloodiest Year to Date.Stratfor Global Intelligence. • Stratfor Global Intelligence (Stratfor). (2011, February 11). Mexico Security Memo: Feb. 22, 2011. Stratfor Global Intelligence. • The Huffington Post. (2011, January 14). Carnival, Other Cruise Ship Lines Fleeing From California. The Huffington Post. • Tuckman, J. (2011, January 14). Mexico drugs war murders data mapped. Retrieved January 14, 2011, from The Guardian Datablog: http://www.guardian.co.uk/news/datablog/2011/jan/14/mexico-drug-war-murders-map • Wilkinson, Tracy. (2010, May 16). Monterrey, Mexico, Finally Feeling the Effects of the Drug War. Los Angeles Times.