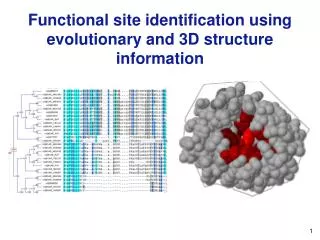
Functional site identification using evolutionary and 3D structure information
Functional site identification using evolutionary and 3D structure information . Reading for this week. “Analysis of Catalytic Residues in Enzyme Active Sites”, Bartlett, Porter, Borkakoti, & Thornton, JMB 2002 (Great paper presenting the physico-chemical features of catalytic sites.)

Functional site identification using evolutionary and 3D structure information
E N D
Presentation Transcript
Functional site identification using evolutionary and 3D structure information
Reading for this week • “Analysis of Catalytic Residues in Enzyme Active Sites”, Bartlett, Porter, Borkakoti, & Thornton, JMB 2002 (Great paper presenting the physico-chemical features of catalytic sites.) • Sriram Sankararaman, Fei Sha, Jack F. Kirsch, Michael I. Jordan, and Kimmen Sjölander, "Active Site Prediction using Evolutionary and Structural Information," Bioinformatics 2010
Enzyme active sites The active site of an enzyme is the region that binds the substrate and contributes the amino acid residues that directly participate in the making and breaking of chemical bonds. http://www-biol.paisley.ac.uk/courses/stfunmac/glossary/active.html
Induced fit binding Daniel Koshland 1958
Holoenzymes, apoenzymes and cofactors Holoenzyme = Apoenzyme + Cofactor Enzymes that require cofactors for function are calledapoenzymesin the absence of a cofactor The form in which the cofactor is bound is called theholoenzyme Cofactors are non-protein atoms or molecules which bind to the apoenzyme. These are often metal ions or a variety of organic molecules.
Metal ion required for function -- once the metal is bound, the enzyme can carry out its function
Allostericenzymes have an extra binding site, the allosteric site, into which a cofactor can bind. This allows the cofactor to act like a switch turning the enzyme either on or off. If the cofactor turns the enzyme on it can be called an activator. If the cofactor turns the enzyme off it can be called an non-competitive inhibitor. (These cofactors are called non-competitive because the cofactor doesn't compete with the substrate for binding to the active site.) These cofactors are often metal ions. Another important cofactor for some allosteric enzymes is the nucleotide cAMP. Allosteric Enzymes
Allosteric Activation http://bio.winona.msus.edu/berg/ANIMTNS/allostan.htm
Competitive inhibition Sometimes the wrong molecule will bind to the active site of an enzyme. Canonical example: Folic acid synthetase. Folic acid synthetase binds PABA and converts it to folic acid. The drug sulfanilamide has a chemical structure very similar to PABA, and will bind to the active site of the enzyme. Folic acid synthetase is incapable of converting sulfanilamide into anything. Therefore once the drug is in the active site of the enzyme, that enzyme becomes inactive. This is called competitive inhibition because the inhibitor competes with the substrate for binding to the active site of the enzyme.
More about More about active sites
Sequence conservation Bartlett et al 2002 Figure 11. Residue conservation scores. The centre of gravity of the catalytic residues in each enzyme was calculated and the conservation score of any residue falling within a sphere of 4 Å, 8 Å, and 12 Å of the centre of gravity was recorded.
Frequency distribution of catalytic residues Figure 4. Observed frequency distribution of catalytic residue types compared with all residues in the dataset. CYSH indicates free cysteine residues. CYSS indicates disulphide-bridged cysteine residues
Residue catalytic propensity Bartlett et al 2002
Catalytic residue types and secondary structure location Bartlett et al 2002
Presence in a cleft Bartlett et al 2002
B-factors of catalytic residues Bartlett et al 2002 Figure 9. Catalytic residue B-factors–a measure of residue flexibility. Absolute B-factors were taken from the PDB file for each enzyme and normalised over the whole protein. Normalised B-factor values were placed into bins and the percentage of residues in each bin displayed.
The Catalytic Site Atlas www.ebi.ac.uk/thornton-srv/databases/CSA/ References The Catalytic Site Atlas: a resource of catalytic sites and residues identified in enzymes using structural data. Porter, Bartlett, and Thornton (2004) Nucl. Acids. Res. Analysis of Catalytic Residues in Enzyme Active Sites. Bartlett, Porter, Borkakoti, and Thornton (2002) J Mol Biol Using a Library of Structural Templates to Recognise Catalytic Sites and Explore their Evolution in Homologous Families. Torrance, Bartlett, Porter & Thornton (2005) J Mol Biol.
The CSA dataset • Original hand-annotated entries, derived from the primary literature. References for these entries are given. • Homologous entries, found by PSI-BLAST alignment (using an e value cut-off of 0.00005) to one of the original entries. • The equivalent residues, which align in sequence to the catalytic residues found in the original entry, are documented. • KS comments: • The second type of entry is a form of annotation transfer
Catalytic residues are… (CSA definition) Directly involved in the biochemical reaction performed by the enzyme • Have direct involvement in the catalytic mechanism, e.g. as a nucleophile • Alter the pKA of a residue or water molecule directly involved in the catalytic mechanism• Stabilize a transition state or intermediate, thereby lowering the activation energy for a reaction • Activate the substrate in some way, e.g. by polarizing a bond to be broken Porter et al. 2004
Predicting catalytic residues • Key features: • Amino acid catalytic propensity • Conservation patterns • Information from 3D structure
Information from 3D structure • Most often in pockets/clefts • Solvent accessible • Must be somewhat accessible (otherwise can’t interact with a substrate!) • Surprisingly, they are not always highly accessible • 3D structure analysis may not be perfectly helpful due to structural flexibility (esp. changes between bound/unbound conformation) • Secondary structure • More often on loop regions Bartlett et al 2002
Evolutionary conservation • Across homologs that share the same function, catalytic residues will be conserved • However, not all homologs will share the exact function! • Thus, not all homologs may agree at positions that are required for function for different subgroups • Binding-pocket residues may have a subfamily-specific pattern of conservation • Conserved within one clade, but different across clades • This is to be expected if substrate/product differences exist between subfamilies
Functional divergence across a family with associated sequence changes D GH S L P D GH S V P D GH S F P D GH T W P D GH G W P D GK - S P D GK S S P D GK T S P D GK G S P D GK A S G D GK A S P
Distinguishing between specificity determinants and active site residues Evolutionary conservation: Some positions are universally conserved among family members. These are obviously critical, and easy to identify.Other positions have subfamily-specific conservation: conserved within functional subfamilies, but divergent across subfamilies. These positions are often critical for the functional specificity of the subfamilies, or they may be critical for the structural integrity of the protein fold. Structural features: Functional residues tend to be at least somewhat exposed to solvent. Catalytic residues tend to be polar or charged and in clefts or pockets SH2 domain binding pocket positions
A look at a few methods for predicting key functional residues Evolutionary Trace (Lichtarge) 3D Cluster Analysis (Landgraf, Xenarios and Eisenberg) FRPred (Fischer, Mayer and Söding) SCI-PHY (Sjölander) INTREPID (Sankararaman and Sjölander) Discern (Sankararaman, Jordan and Sjölander) • Also see these two methods using machine learning methods and information from protein 3D structure and sequence: • Gutteridge,A. et al. (2003) Using a neural network and spatial clustering to predict the location of active sites in enzymes. J. Mol. Biol., 330, 719–734. • Youn,E. et al. (2007) Evaluation of features for catalytic residue prediction in novel folds. Protein Sci., 16, 216–226.
Shannon entropy Fischer, Mayer and Söding, Bioinformatics 2008
Relative entropy(aka Kullback-Leibler distance, or K-L distance) A measure of difference between probabilistic models (not a true “distance”, despite the name) Courtesy of Ian Holmes
Relative entropy confers certain benefits over Shannon entropy Fischer, Mayer and Söding, Bioinformatics 2008
Jensen-Shannon Divergence JS-divergence used in the following functional site prediction methods: INTREPID, FRpred, and Capra and Singh, Bioinformatics, 2007 JS definition taken from www.ccs.neu.edu/home/jaa/CSG399.05F/Homeworks/HW03.pdf
Evolutionary Trace Algorithm: Input: MSA, Tree and 3D structure 1. Take vertical slices of tree, starting at root. 2. Identify subtrees defined by slice of tree. 3. Identify positions displaying subtree-specific conservation 4. Plot these positions on the structure. While (highlighted positions display primarily on one face of the protein structure) repeat steps 1-4. Output: Cut of tree with conserved residues highlighted on structure. These residues can then be predicted to represent the binding pocket(s) of the protein.
New Evolutionary Trace methods make use of entropy calculations to improve performance http://mammoth.bcm.tmc.edu/report_maker/ A family of evolution–entropy hybrid methods for ranking protein residues by importance, Mihalek et al, JMB 2004 Evolutionary trace report_maker: a new type of service for comparative analysis of proteins, Mihalek et al, Bioinf. 2006
Seq1 LERY-K Seq2 LDRFPR Seq3 IERYGK Seq4 MDRF-K Seq5 VERYGK 5 3 1 4 2 Phylogenetic tree & subfamily decomposition Multiple sequence alignment (MSA) Seq5 VERYGK Seq3 IERYGK Seq1 LERY-K Seq4 MDRF-K Seq2 LDRFPR Subfamily HMMs Detection of critical positions SCI-PHY subfamily identification Brown, Krishnamurthy & Sjölander, "Automated Protein Subfamily Identification and Classification," PLoS Computational Biology 2007
Specificity determinantscan be identified using subfamily-specific conservation patterns SH2 domain analysis: Only 2 of 16 binding pocket positions show perfect conservation. But almost all show significant conservation within subfamilies. Most important for phosphopeptide specificity SH2 domains recognize specific phosphopeptide sequences. Songyang et al, Cell 1993
FRPred In brief: FRpred sequence information only, but achieves a performance roughly equal to two methods that use actual knowledge of 3D structure (SVM: Youn et al, Neural network: Gutteridge et al). Techniques used include: prediction of solvent accessibility and secondary structure, windowing scores, different information-theoretic measures.
Two new methods for protein functional site identification from the Berkeley Phylogenomics Group INTREPID (evolutionary info only) Discern(evolution + structure info)
INTREPIDInformation-theoretic TREe Traversal for Protein functional siteIdentification • Motivation • Biologists are typically interested in a single protein, not the whole family • Not all proteins in large diverse families use all positions identically • Active sites may be perfectly conserved, but other key positions are more likely to vary across subtypes • Structural divergence and alignment errors will contribute noise Sriram Sankararaman and Kimmen Sjölander, "INTREPID - INformation-theoretic TREe traversal for Protein functional site IDentification," Bioinformatics 2008; doi: 10.1093/bioinformatics/btn474
Perfectly conserved positions are easy to detect D G H S L P D G H S V P D G H S F P D G H T W P D G H G W P D G K - S P D G K S S P D G K T S P D G K G S P D G K A S G D G K A S P
Specificity determinants D G H S L P D G H S V P D G H S F P D G H T W P D G H G W P D G K - S P D G K S S P D G K T S P D G K G S P D G K A S G D G K A S P • Knowledge of functional groupings can be used to find positions that differentiate subtypes • However: • this information is seldom available • Residue conservation due to close evolutionary relationships complicates specificity residue prediction
Not all positions are important for all subtypes D G H S L P D G H S V P D G H S F P D G H T W P D G H G W P D G K - S P D G K S S P D G K T S P D G K G S P D G K A S G D G K A S P Binding pocket positions may not be equally conserved across all subfamilies, especially if the substrate has changed shape or size
Different strokes for different folks D GH S L P D GH S V P D GH S F P D GH T W P D GH G W P D GK - S P D GK S S P D GK T S P D GK G S P D GK A S G D GK A S P S1 S2