Download
1 / 34
340 likes | 476 Vues
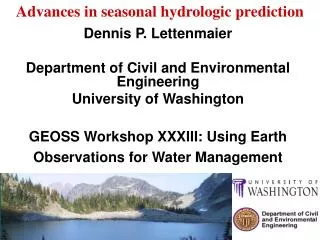
Advances in seasonal hydrologic prediction. Dennis P. Lettenmaier Department of Civil and Environmental Engineering University of Washington GEOSS Workshop XXXIII: Using Earth Observations for Water Management San Francisco December 18, 2009. Background

E N D
Advances in seasonal hydrologic prediction Dennis P. Lettenmaier Department of Civil and Environmental Engineering University of Washington GEOSS Workshop XXXIII: Using Earth Observations for Water Management San Francisco December 18, 2009
Background The University of Washington west-wide seasonal hydrologic forecast system Current and recent research -- assimilation of satellite data Is there hydrologically useful skill in climate forecasts? Concluding thoughts Talk Outline
Reservoir Storage Aug Dec Apr Aug 1. Background: The importance of Seasonal Hydrologic Forecasting water management hydropower irrigation flood control water supply fisheries recreation navigation water quality
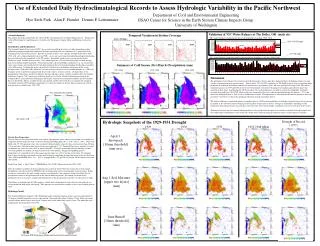
Application of statistical methods to seasonal hydrologic prediction in the western U.S. PNW Snow water content on April 1 SNOTEL Network McLean, D.A., 1948 Western Snow Conf. April to August runoff
Overview: ESP Hydrologic prediction strategy ESP data flow The ESP “spider web”
2. The University of Washington west-wide seasonal hydrologic forecast system 6-month ESP streamflow forecasts for western U.S. and Mexico effective 12/7/09
Forecast System Initial State information Observed SWE Snowpack Simulated Initial Condition Soil Moisture Simulated Initial Condition
Flow location maps give access to monthly hydrograph plots, and also to raw forecast data. Clicking the stream flow forecast map also accesses current basin-averaged conditions Streamflow Forecast Details
MODIS updating of snow covered area MODIS Update local scale weather inputs Initial Conditions: soil moisture, snowpack Hydrologic model spin up Hydrologic simulation Ensemble Forecast: streamflow, soil moisture, snowpack, runoff NCDC met. station obs. up to 2-4 months from current LDAS/other real-time met. forcings for remaining spin-up End of Month 6 - 12 1-2 years back 25th Day of Month 0 Change in Snowcover as a Result of MODIS Update for April 1, 2004 Forecast Snowcover before MODIS update Snowcover after MODIS update
Unadjusted vs adjusted forecast errors, 2001-2003, for reservoir inflow volumes (left plot) and reservoir storage (right)
4: Is there hydrologically relevant skill in climate forcings
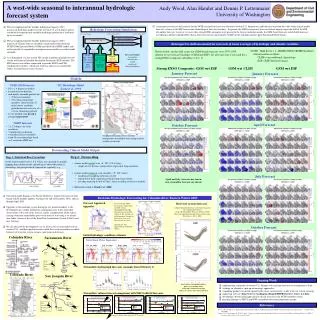
Wood et al 2005: Retrospective Assessment: Results using GSM General finding is that NCEP GSM climate forecasts do not add to skill of ESP forecasts, except… April GSM forecast with respect to climatology (left) and to ESP (right)
Wood et al 2005: Retrospective results for ENSO years Summary: During strong ENSO events, for some river basins (California, Pacific Northwest) runoff forecasts improved with strong-ENSO composite; but Colorado River, upper Rio Grande River basin RO forecasts worsened. October GSM forecast w.r.t ESP: unconditional (left) and strong-ENSO (right)
Reverse ESP vs ESP – typical results for the western U.S. Columbia R. Basin fcst more impt ICs more impt Rio Grande R. Basin
VIC model long-term (1960-99) simulations at ½ degree spatial resolution assumed to be truth DEMETER reforecasts with ECMWF seasonal forecast model for 6 month lead, forecasts made on Feb 1, May 1, Aug 1, Nov 1 1960-99 9 forecast ensembles on each date Forecast forcings (precipitation and temperature) downscaled and bias corrected using Wood et al approach (also incorporated in UW West-wide system) On each forecast date, 9 ensemble members also resampled at random from 1960-99 to form ESP ensemble Forecast skill evaluated using Cp for unrouted runoff DEMETER forecast evaluation
Hydrologic prediction skill at S/I lead times comes mostly from initial conditions. Hence more focus on data assimilation, and its implications for hydrologic forecast skill, needs more attention. The role of model error in hydrologic predictions needs more focus – how do we best weight land models in multimodel ensemble? Do hydrologists (and the land data assimilation community) need to expend more effort on hydrologic forecasting? Concluding thoughts
Streamflow forecast skill, observed streamflow simulated (left panel) and forecasted (right two) using model soil moisture and SWE; MAMJ streamflow conditioned on January 1 model conditions
UW Multi-model monitor • Same approach as VIC-based SWM • Models include VIC, Noah, CLM, Sac
The challenge: Different land schemes have different soil moisture dynamics Model simulated soil moisture at cell (40.25N, 112.25W)
NE NW SW SE Areas for spatially averaged soil moisture percentiles Box sizes are 5 x 5 degrees
Soil Moisture Percentiles w.r.t. 1920-2003 2008-07-01 VIC CLM SAC NOAH ENSEMBLE US Drought Monitor
Summary • West-wide forecast system and SW Monitor are templates for exploration of new forecasting methods • Methods perform well in the U.S., where surface obs are relatively abundant. • However, ongoing work illustrates the potential for using similar methods in areas where in situ obs are sparse, using e.g. remotely sensed precipitation, and/or weather prediction model analysis fields. • New remote sensing data sources (e.g. SWOT) offer tremendous opportunities for extension of these methods to the underdeveloped world.