Download
1 / 42
420 likes | 508 Vues
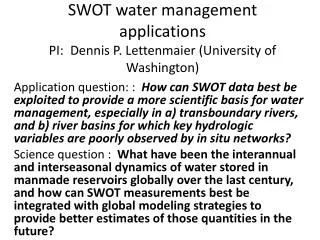
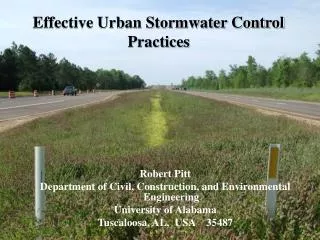
Opportunities for Remote Sensing in Hydrologic Prediction and Water Management in the Pacific Northwest. Dennis P. Lettenmaier Department of Civil and Environmental Engineering University of Washington Pacific Northwest Regional Remote Sensing Collaboratory Workshop Seattle January 21, 2003.

E N D
Opportunities for Remote Sensing in Hydrologic Prediction and Water Management in the Pacific Northwest Dennis P. Lettenmaier Department of Civil and Environmental Engineering University of Washington Pacific Northwest Regional Remote Sensing Collaboratory Workshop Seattle January 21, 2003
Regional (continental watershed) scale hydrological modeling and prediction
Study Area Selection • Study areas: • Columbia River Basin • Missouri River Basin • Basins characterized by: • Importance of Snow • Highly regulated river flows
March 30, 2000 April 7, 2000
April 24, 2000 May 1, 2000
Pixel-by-Pixel Comparisons Classification grid: Error of Omission Error of Commission
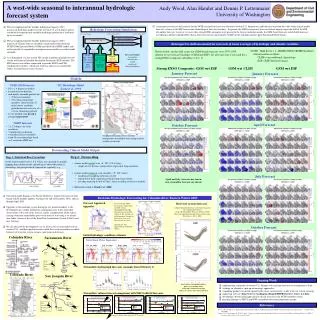
Overview of ColSim Reservoir Model Reservoir Operating Policies Reservoir Storage Regulated Streamflow Flood Control Energy Production Irrigation Consumption Streamflow Augmentation Physical System of Dams and Reservoirs Streamflow Time Series
Dam Operations in ColSim Storage Dams Virgin Regulated Run-of-River Dams Flow In=Flow out + Energy H
IDWR Internet Map Server Showing Cumulative ET for 2000 in the Eastern Snake River Plain Based on SEBAL remote sensing product [http://maps.idwr.state.id.us/espa_et/viewer.htm]
Remotely sensed estimates of 24 hour ET for the Bear River Basin in Idaho, Utah,Wyoming from SEBAL [ http://www.idwr.state.id.us/gisdata/ET/preliminary_results.htm ]
Local (catchment) scale hydrological modeling and prediction
Land surface characterization required by DHSVM • Terrain - 150 m. aggregated from 10 m. resolution DEM • Land Cover - 19 classes aggregated from over 200 GAP classes • Soils - 3 layers aggregated from 13 layers (31 different classes); variable soil depth from 1-3 meters • Stream Network - based on 0.25 km2 source area
4 km 12 km 36 km Overview of high resolution mesoscale atmospheric prediction models Initialization and boundary conditions from global simulations Vertical grid spacing (37 layers) Detail of 4 km high resolution ‘nest’ over Washington State Horizontal grid spacing Boundary conditions Horizontal grid spacing
DHSVM Calibration (Snoqualmie at Carnation) Flood of record Principal calibration locations were the Skykomish at Gold Bar and the Snoqualmie at Carnation
Validation Results: Rex River inflow to Chester Morse Lake 6 year total inflow Cubic Feet Nov 1995 to Feb 1996 3 hour Predicted Daily Observed CFS 60 day total volume Predicted Observed Cubic Feet 13.4 mi2
2000/2001 Real-time Streamflow Forecast System 26 basins 48,896 km2 2,173,155 pixels @ 150 m resolution http://hydromet.atmos.washington.edu
Forest Harvest and Road ConstructionHard and Ware Creeks, WA
SWE difference for February 1996ROS event; harvest - no harvest More snow at beginning of event Less snow at end of event
Simulated response to forest harvestSub-basins of the Deschutes River, WA
Effect of forest roads on water table Drier with roads Wetter with roads
Simulated streamflow w/ and w/o forest roads Hard Creek Ware Creek Hard Creek Ware Creek
DHSVM MASS WASTING SURFACE EROSION CHANNEL EROSION Qsed Q OUTPUT Sediment Modeling with the DHSVM Watershed Sediment Module Watershed Sediment Module
Portraying Watershed ChangeSediment Model Effect of wildfire on simulated root cohesion Wildfire in the Icicle Creek basin
Probability of slope failure before and after Fourth of July Fire Pre-fire Approximate extent of August 2001 fire Post-fire Icicle Creek Vegetation
tree height bank-to- canopy canopy height buffer width buffer width Portraying Watershed ChangeStream Temperature Model
23.21 23.2 22.3 23.4 23.3 23.2 24.1 24.8 23.3 25.1 Simulated 10 year maximumstream temperatures • Wenatchee River 5th field watersheds • Current conditions Temperatures in degrees Celsius
Recreating spatial harvest history: Historical data (top) GAP analysis (bottom) based on Landsat TM
Lakes and wetlands -- Arctic coastal plain Source: San Diego State University Global Change Research Group
Putuligayuk River Landcover from Landsat MSS images (Muller et al. 1999).
Surveyed areas Prudhoe Bay Betty Pingo site Basin boundary Putuligayuk River 10 km RadarSATSAR ground truth data
2000 = wet = dry Saturated extent from RADARSAT - Putuligayuk River, Alaska a. b. c. d. e.