Download
1 / 64
640 likes | 658 Vues
Explore an experimental seasonal hydrologic forecast system for the U.S., focusing on technological development, collaboration, and applications to address water resource issues and climate changes.

E N D
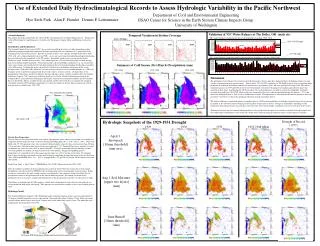
Experimental seasonal hydrologic forecast system for the western U.S. Dennis P. Lettenmaier Department of Civil and Environmental Engineering University of Washington CSIRO Land and Water Seminar Series September 28, 2009
Outline 1) Overview 2) Two systems: • Surface Water Monitor (1/2 degree, mostly nowcast (some drought forecast), multimodel • West-wide forecast system (1/8 degree, VIC only, nowcast and streamflow forecasts) • The role of calibration • Data assimilation 5) Hydrologic predictability • Technological development and transfer • Nation-wide and International collaboration 6) Ongoing applications and related work
Why do we need an experimental hydrological prediction system? • From Wood and Lettenmaier (BAMS, 2006): • Despite the potential benefits of improved hydrologic forecasts, most operational hydrologic prediction at seasonal lead times … are based on methods and data sources that have been in place for almost half a century. • The skill of western U.S. seasonal streamflow forecasts has generally not improved since the 1960s. • While forecast accuracy improvements would likely result from observing system densification, the need for long data records in regression-based methods would take decades to realize, and would be complicated by a changing climate. • We believe that a more promising pathway lies in the development of methods … for assimilating new sources of observational data into land surface energy and water balance models, which can then be forced with modern climate and weather forecasts.
One reason for the slow progress in hydrologic prediction has been the lack of real-time testing of new prediction models and methods …
Will help to address emerging water resources operation and planning issues (e.g., nonstationarity) Better exploit predictability in weather and climate (which is inherently at progressively larger scales with lead time) Utilize macroscale models (which are amenable to to-down application at large continental and sub-continental scales) Make better use of methods, like data assimilation, that can use large scale data sources to improve hydrologic initial conditions The need for a national perspective on hydrologic prediction
Bias correction is a key step in linking large scale atmospheric forecast models with macroscale hydrologic forecasting From Wood et al (2002) – development of a hydrologically based statistical downscaling method
Downscaling Test • Start with GSM-scale monthly observed met data for 21 years • Downscale into a daily VIC-scale time series • Force hydrology model to produce streamflow • Is observed streamflow reproduced?
start of month 0 end of month 6 1-2 years back VIC forecast ensemble VIC model spin-up VIC climatology ensemble NCDC met. station obs. up to 2-4 months from current LDAS/other met. forcings for remaining spin-up climate forecast information (from GSM) data sources Forecast Products streamflow soil moisture runoff snowpack A B C Simulations
University of Washington/Princeton UniversityNorth American Hydrological Systems(NAHS) ½ NCAST Multi-model Low resolution (1/2 degree) SWM Drought ESP Drought Multi-model Monitoring NAHS Drought CPC Forecast 1/8 NCAST High resolution (1/8 degree) WSHFS ESP US MEX In progress (09/2009) CPC CFS done
Surface Water Monitor Drought Monitoring Daily nowcast of Soil moisture and Runoff percentiles at ½ deg spatial resolution. Multimodel based ensembles for the CONUS and Mexico Drought Prediction Forecast of Soil Moisture (SM) and 3 months cumulative Runoff (RO) percentile at ½ deg spatial resolution out to 1 to 3 months. http://www.hydro.washington.edu/forecast/monitor/index.shtml
Drought Monitoring(Daily Process Flow) Previous day’s meteorological observations from index stations, gridded to 0.5 degree All models use same input forcings, different formats Average Percentiles Model results expressed as percentiles of historical output Compute Percentiles Make Plots
Multimodel based SM percentile Nowcast (2009-09-23) (http://www.hydro.washington.edu/forecast/monitor/curr/conus.mexico/main_sm.multimodel.shtml) SAC NOAH_2.8 VIC Multimodel CLM • Models used: • VIC 4.0.6 • Noah 2.8 • Sacramento/Snow-17 (SAC) • CLM 3.5
Drought Prediction http://www.hydro.washington.edu/forecast/monitor/outlook/index.shtml • Forecasts based on: • Ensemble Streamflow Prediction (ESP) • Climatological (1950-2004) weather ensembles • ENSO years only • Climate Prediction Center (CPC) weather forecasts • Climatological weather ensembles adjusted by CPC predicted monthly anomalies. (Work in progress)
Climatological ESP based 1 month lead SM percentile forecast Initial Hydrologic Conditions on 2009-09-18 ENSO subset ESP based 1 month lead SM percentile forecast CPC forecast-based 1 month lead SM percentile forecast
Climatological ESP based 3 month lead RO percentile forecast Initial Hydrologic Conditions on 2009-09-18 ENSO subset ESP based 3 month lead RO percentile forecast CPC forecast-based 3 month lead RO percentile forecast
Use of SWM in United States Drought Monitor SWM SM and RO percentile nowcast is used by USDM for drought monitoring http://www.drought.gov/portal/server.pt/community/drought_indicators/223/soil_moisture/278
Use of SWM in Drought Outlook SWM ESP based forecast is one of the tools consulted in the monthly drought monitor briefings to provide drought outlook http://www.drought.gov/portal/server.pt/community/forecasting/209/soil_moisture/338
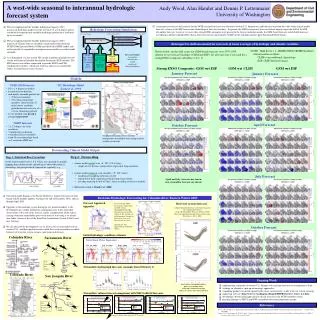
University of Washington/Princeton University West-wide Seasonal Hydrological Forecast System (WSHFS) http://www.hydro.washington.edu/forecast/westwide/ Sub-continental Mid-Resolution
The WSHFS NCAST (nowcast) forecast University of Washington University of Washington and IMTA (Mexico)
The WSHFS monitoring and forecast • Quasi-real-time daily representation of current Hydrological Conditions: NCAST • Currently covers all US, Mexico, and the upper Columbia basin in Canada • NCAST downloads meteorological data from ACIS (NCDC-COOP stations) in the US, Environment Canada, and Servicio Meteorológico Nacional (or NARR and NLDAS) in Mexico • Over 2300 stations are used by Index-station method to generate the forcings at 1/8 degree (>800 in Mexico and 10 in the Upper Columbia River Basin in Canada) • Assimilates SNOTEL data (NCAST and Forecast) • ESP-and CPC-based Streamflow forecast on more than 200 stations over most of the US (and ESP-based on more than 20 over México)
NCAST Evolution University of Washington University of Washington and Princeton University
University of Washington/Princeton UniversityNorth American Hydrological Systems(NAHS) ½ NCAST Multi-model Low resolution (1/2 degree) SWM Drought ESP Drought Multi-model Monitoring NAHS Drought CPC Forecast 1/8 NCAST High resolution (1/8 degree) WSHFS ESP US MEX In progress (09/2009) CPC CFS done
WSHFS (current operations) ESP CPC
Forecast System Initial State information Observed SWE Snowpack Simulated Initial Condition Soil Moisture Simulated Initial Condition
spatial weighting function elevation weighting function SNOTEL/ASP VIC cell Forecast System Initial State Snow Adjustment • Assimilation Method • weight station OBS’ influence over VIC cell based on distance and elevation difference • number of stations influencing a given cell depends on specified influence distances • distances “fit”: OBS weighting increased throughout season • OBS anomalies applied to VIC long term means, combined with VIC-simulated SWE • adjustment specific to each VIC snow band
Flow location maps give access to monthly hydrograph plots, and also to raw forecast data. Clicking the stream flow forecast map also accesses current basin-averaged conditions Streamflow Forecast Details
Winter 2006-07:seasonal volume forecast for APR-SEP OBS Forecasts made on 1st of Month
Is calibration necessary? • Approach: Use percentile mapping bias correction on uncalibrated forecasts, compare Cp (1 – forecast MSE/unconditional variance) for calibrated and uncalibrated (using N-LDAS parameters) for a range of forecast dates and lead times at 8 forecast sites throughout the western U.S. • Result: Bias corrected uncalibrated forecasts did nearly as well at most sites, and better at some • Conclusion: Perhaps calibration (the Achilles Heel of dynamic hydrologic forecasting methods) isn’t really necessary Details: Shi et al, JH< 2009
What are the sources of skill in seasonal hydrological forecasts?
Results of previous seasonal hydrologic predictability studies for continental U.S. • Wood et al, “A retrospective assessment of NCEP climate model-based ensemble hydrologic forecasting in the western United States”, JGR, 2005 • Wood, “An ensemble-based framework for characterizing sources of uncertainty in hydrologic prediction” • Work in progress, DEMETER forecasts over continental U.S.
Wood et al 2005: Retrospective Assessment: Results using GSM General finding is that NCEP GSM climate forecasts do not add to skill of ESP forecasts, except… April GSM forecast with respect to climatology (left) and to ESP (right)
Wood et al 2005: Retrospective results for ENSO years Summary: During strong ENSO events, for some river basins (California, Pacific Northwest) runoff forecasts improved with strong-ENSO composite; but Colorado River, upper Rio Grande River basin RO forecasts worsened. October GSM forecast w.r.t ESP: unconditional (left) and strong-ENSO (right)
Reverse ESP vs ESP – typical results for the western U.S. Columbia R. Basin fcst more impt ICs more impt Rio Grande R. Basin
VIC model long-term (1960-99) simulations at ½ degree spatial resolution assumed to be truth DEMETER reforecasts with ECMWF seasonal forecast model for 6 month lead, forecasts made on Feb 1, May 1, Aug 1, Nov 1 1960-99 9 forecast ensembles on each date Forecast forcings (precipitation and temperature) downscaled and bias corrected using Wood et al approach (also incorporated in UW West-wide system) On each forecast date, 9 ensemble members also resampled at random from 1960-99 to form ESP ensemble Forecast skill evaluated using Cp for unrouted runoff DEMETER forecast evaluation
Summary There isn’t much prediction skill in dynamical global forecast models at lead times more than ~ 1 month, except possibly in ENSO non-neutral years Most hydrological forecast skill therefore derives from knowledge of initial conditions Some climate forecast skill can nonetheless be derived from categorical forecasts (e.g., stratified ESP forecasts)
Applications and Research • Climate Impacts Group • Quarterly Forecast for the PNW • Annual Forecast for users in the states of WA, OR, and ID • Wildfire Forecast (UC Merced and USDA Forest Service) • CLIMAS (University of Arizona and Mexican Institutions) • Drought Predictability over Mexico using WSHFS and applying ESP and CFS techniques • An average of 1.2 requests of data per month, including forcings and forecast consults • US and Mexican agencies and Institutes consult or are in process to use some of the tools (Instituto Mexicano de Tecnologia del Agua [IMTA], Comision Nacional del Agua [CNA])
Applications Wildfire Forecast CLIMAS Climate Impacts Group
Border Drought Predictability Assessment VIC VIC VIC 2007 Initializations Mar, May, Jul, Sep, Nov ESP CFS 1971-2000 1971-2000 NCAST Long-term Historical Observed Atmos. Forcing Realtime Atmos. Forcing Modelling-based Atmos. Forcing + Long-term Long-term Hydrological States Realtime Hydrological States CFS-Long-term Hydrological States Mexico, North Central, Northwest, andSouth RMSE OBS (NCAST) and Forecast (ESP and CFS) Soil Moisture Percentiles (SMI) ESPs , CFSs, and Nowcast
Ensemble Performance (soil moisture Percentiles) Observations Forecasts Initial Conditions March ESP CFS April May June 2007
Snow data assimilation: Remote Sensing applications http://www.hydro.washington.edu/forecast/rsda/ Regional High Resolution
Remotely Sensed Snow for Streamflow Forecast Aqua Terra MODIS UW Hydrological Forecast System Snow Data Snowpack Initial Condition Streamflow forecast
Snow cover areal (SCA) Ablation period Ablation period Feather River Oroville Reservoir SCA (%) SCA: snow cover percentage of total area in the Feather River basin, California.