Download
1 / 12
130 likes | 351 Vues
Seagrass Conservation in Texas Coastal Waters:. Monitoring Design Criteria and Biological Indicators for R-EMAP Region 6 Kelly Fellows 11/26/02. Regional Environmental and Monitoring Assessment Program (R-EMAP).

E N D
Seagrass Conservation in Texas Coastal Waters: Monitoring Design Criteria and Biological Indicators for R-EMAP Region 6 Kelly Fellows 11/26/02
Regional Environmental and Monitoring Assessment Program (R-EMAP) EMAP is a research program to develop the tools necessary to monitor and assess the status and trends of national ecological resources. • R-MAP tests the applicability of the EMAP approach • Uses smaller geographic scales and shorter time frames.
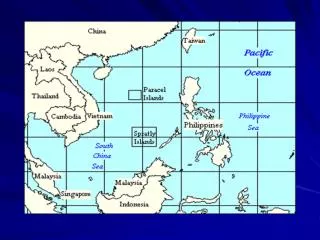
Study Sites Red Fish Bay Lower Laguna Madre
Sampling Design • Hexagons were created using the Theissen function • 60 hexagons total at each site • 1 random site generated within each hexagon
What was measured? • Physiochemical Parameters • Total Suspended Solids/Light Attenuation • Nutrients • Chlorophyll • Drift Algae • Seagrass Biomass
…a lot of samples! • 900 bags of biomass cores • 600 bags of algae • 540 water samples for • Total Suspended Solids • Dissolved Inorganic Nitrogen • Chlorophyll • physiochemical measurements
Results: Depth and Salinity Depth (cm) Salinity (ppt)
Results: TSS vs Light Attenuation TSS (mg/L) Light Attenuation (m-1)
Future Work • Create more maps showing kriging of variables. • Compare some of the Red Fish Bay data with Lower Laguna Madre.
Acknowledgements • Andrea Kopecky and Dr. Kenneth Dunton, University of Texas Marine Science Institute • Jon Goodall and Dr. David Maidment