Download
1 / 24
260 likes | 391 Vues
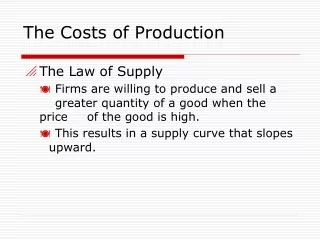
16. The Behavior of Costs. Behavior of Costs. Cost-volume relationships : Fixed and variable costs Step-function costs. Relation of costs to volume. Higher volume causes higher costs : Variable costs = items of cost that vary, in total, directly and proportionately with volume

E N D
16 The Behavior of Costs
Behavior of Costs • Cost-volume relationships: • Fixed and variable costs • Step-function costs
Relation of costs to volume • Higher volume causes higher costs: • Variable costs = items of cost that vary, in total, directly and proportionately with volume • Fixed costs = non-variable costs = items of cost that, in total, do not vary with volume • Semivariable costs = semifixed costs = partly variable costs = mixed costs = costs that include a combination of variable and fixed cost items
Variable Costs • Items of cost that vary, in total, directly and proportionately with volume: • Volume refers to activity level • Examples: • Material costs varies with units sold • Electricity costs varies with production hours • Stationery and postage costs varies with number of letters written
Fixed costs • Non-variable costs = items of cost that, in total, do not vary with volume: • Examples: • Building rent, property taxes, management salaries • Fixed cost per unit of activity decreases as the level of activity increases • Fixed costs are fixed for a range of activity and a limited period of time • Fixed costs may change for reasons such as a deliberate management decision to change them
Cost-volume (C-V) diagram • Y or vertical axis reflects total cost • X or horizontal axis reflects volume • y = mx + b • y is the cost at a volume of x • m is the rate of cost change per unit of volume change, or the slope (variable costs) • b is the vertical intercept, which represents the fixed cost component
TC = TFC +(UVC*X) • TC = total cost • TFC = total fixed cost (per time period) • UVC = Unit variable cost (per unit of volume) • X = volume • Equations for: • Variable cost line: TC = UVC*X • Fixed cost line: TC = TFC • Semivariable cost: TC = TFC + (UVC*X)
Cost Relations • Average costs = total cost/volume • Average cost behaves differently than total cost • As volume goes up: • Total fixed cost remains constant, total variable costs goes up, per unit variable costs stays the same, per unit fixed cost goes down, per unit total cost goes down • As volume increases without limit, unit cost approaches variable unit cost and fixed cost per unit approaches zero
Limitations of C-V Relations • A straight line approximates cost behavior only within a certain range of volume, the relevant range: • When volume approaches zero, management takes steps to reduce fixed costs • When volume exceeds relevant range, fixed costs increase
Limitations (continued) • Amount of variable costs depends on the time period over which behavior is estimated (the relevant time period): • If the time period is one day, few costs are variable • Over an extremely long time period, no costs are fixed • Environmental assumptions must be made: • Wage rates, fringe benefits, material prices, technology changes
“Sticky” Costs • Generally considered variable but fall less with decreases of activity than they rise with increases • Managers tend to increase resources more quickly than they decrease • Examples: • Sales commissions with minimum guarantees • Managers slower to fire employees than to hire
Step-function costs • Incurred when costs are added in discrete chunks, e.g. a supervisor for every 10 • Adding the “chunk” of costs increases capacity • Height of a stair step (riser) indicates cost of adding incremental capacity • Step width (tread) shows how much additional volume of activity can be serviced by an additional increment of capacity
Step function (continued) • If treads” are narrow and “risers” are low (i.e. steps are small), then steps can be approximated by a variable cost line • If it is believed within relevant time period, cost will remain within relevant range for a single stair step (tread), then cost is appropriately treated as a fixed cost for time period • Step functions are often hidden in C-V diagrams as either variable or fixed costs
Questions to consider in selecting a volume measure • Input (resources used) or output (goods or services produced)? • Money or non-monetary quantities?
Input or output? • Input measures: resources used (labor hours worked, labor cost, machine hours, kilowatt hours of electricity, pounds of material) • Output measures: units or dollars • Manufacturing costs might use input measures such as labor or machine hours • Retail stores might use dollar sales
Money or non-monetary quantities? • A non-monetary measure is not affected by price changes and therefore may have some advantages • If price changes affect all costs equally, use of labor costs as an activity measure implicitly allows for price changes • Best volume measure should be related to the activity that causes cost • The more items of cost that are combined in the cost function the more difficult it is to relate causality to a single measure
Profit-graph • Add revenue line to C-V diagram • Assumes constant selling price • UP = unit price= selling price • TR = total revenue
Breakeven volume • TR = UP*X • TC = TFC + (UVC*X) • Breakeven: TR = TC • Substituting: UP*X = TFC + (UVC*X) X = TFC/(UP - UVC)
Contribution • Unit contribution = unit contribution margin = marginal income = unit selling price - variable cost per unit = UP - UVC • I = total income = (UP - UVC) * X - TFC • What is contribution: • First: contribution to cover fixed costs • Then: contribution toward profit
Break-even volume • In units = Fixed costs/unit contribution • In revenue dollars = Fixed costs / contribution percent • Contribution percent = contribution margin percentage = contribution as a percent of revenues = (UP - UVC)/ UP
Target Profit • Add to breakeven analysis to show units or dollar of sales to achieve a target (T) level of profit: UP*X = TFC + (UVC*X) + T X = (TFC+T)/(UP - UVC)
Profit-graph shows how to improve profit performance: • Increase selling price • Decrease variable cost • Decrease fixed cost • Increase volume
Measures of volume • Have assumed a single-product • If multiple productswith different cost structures, unlikely that units would be a reliable measure of activity: • Possible common denominators include: labor hours, labor dollars, machine hours, homogeneous quantities such as tons or barrels and sales value
16 End of Chapter 16