Download
1 / 58
580 likes | 754 Vues
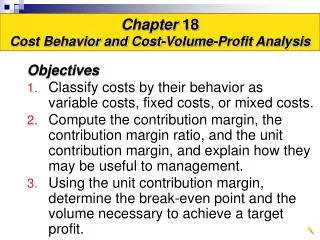
Chapter 18 Cost Behavior and Cost-Volume-Profit Analysis. Objectives Classify costs by their behavior as variable costs, fixed costs, or mixed costs.

E N D
Chapter 18 Cost Behavior and Cost-Volume-Profit Analysis Objectives • Classify costs by their behavior as variable costs, fixed costs, or mixed costs. • Compute the contribution margin, the contribution margin ratio, and the unit contribution margin, and explain how they may be useful to management. • Using the unit contribution margin, determine the break-even point and the volume necessary to achieve a target profit.
Objectives • Using a cost-volume profit chart and a profit-volume chart, determine the break-even point and the volume necessary to achieve a target profit. • Calculate the break-even point for a business selling more than one product. • Compute the margin of safety and the operating leverage, and explain how managers use this concept. • List the assumptions underlying cost-volume-profit analysis.
Cost Behavior Variable Cost Jason Inc. produces stereo sound systems under the brand name of J-Sound. The parts for the stereo are purchased from an outside supplier for $10 per unit (a variable cost).
Variable Cost Total Variable Cost Graph Unit Variable Cost Graph $300,000 $250,000 $200,000 $150,000 $100,000 $50,000 $20 $15 $10 $5 Total Costs Cost per Unit 0 10 20 30 Units Produced (in thousands) 0 10 20 30 Units Produced (000)
Variable Cost $300,000 $250,000 $200,000 $150,000 $100,000 $50,000 $20 $15 $10 $5 Cost per Unit Total Costs 0 10 20 30 Units Produced (000) 0 10 20 30 Units Produced (000) Number of Units Produced Direct Materials Cost per Unit Total Direct Materials Cost 5,000 units $10 $ 50,000 10,000 10 l00,000 15,000 10 150,000 20,000 10 200,000 25,000 10 250,000 30,000 10 300,000
La Fleur Fixed Costs The production supervisor for Minton Inc.’s Los Angeles plant is Jane Sovissi. She is paid $75,000 per year. The plant produces from 50,000 to 300,000 bottles of perfume.
Fixed Costs Total Salary for Jane Sovissi Number of Bottles Produced Salary per Bottle Produced 50,000 bottles $75,000 $1.500 100,000 75,000 0.750 150,000 75,000 0.500 200,000 75,000 0.375 250,000 75,000 0.300 300,000 75,000 0.250
Fixed Costs Total Fixed Cost Graph Unit Fixed Cost Graph $150,000 $125,000 $100,000 $75,000 $50,000 $25,000 $1.50 $1.25 $1.00 $.75 $.50 $.25 Cost per Unit Total Costs 0 0 100 200 300 100 200 300 Bottles Produced (000) Units Produced (000) Number of Bottles Produced Total Salary for Jane Sovissi Salary per Bottle Produced 50,000 bottles $75,000 $1.500 100,000 75,000 0.750 15,000 75,000 0.500 20,000 75,000 0.375 25,000 75,000 0.300 30,000 75,000 0.250
Mixed Costs Simpson Inc. manufactures sails using rented equipment. The rental charges are $15,000 per year, plus $1 for each machine hour used over 10,000 hours.
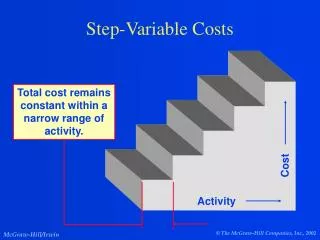
Mixed Costs Mixed costs are sometimes called semivariable or semifixed costs. Total Mixed Cost Graph $45,000 $40,000 $35,000 $30,000 $25,000 $20,000 $15,000 $10,000 $5,000 Mixed costs are usually separated into their fixed and variable components for management analysis. Total Costs 0 10 20 30 40 Total Machine Hours (000)
Low High Mixed Costs The high-low method is a simple way to separate mixed costs into their fixed and variable components.
High-Low Method Actual costs incurred Production Total (Units) Cost $ Activity relates to units of production June 1,000 $45,550 July 1,500 52,000 August 2,100 61,500 September 1,800 57,500 October 750 41,250 Highest level of activity ($) minus lowest level of activity ($) Variable cost per unit = Highest level of activity (units) minus lowest level of activity (units)
$20,250 1,350 High-Low Method Actual costs incurred Production Total (Units) Cost June 1,000 $45,550 July 1,500 52,000 August 2,100 61,500 September 1,800 57,500 October 750 41,250 $61,500 – $41,250 Variable cost per unit = = 2,100 – 750 = $15
High-Low Method Actual costs incurred Variable cost per unit = $15 Production Total (Units) Cost What is the total fixed cost (using the highest level)? June 1,000 $45,550 July 1,500 52,000 August 2,100 61,500 September 1,800 57,500 October 750 41,250 Total cost = (Variable cost per unit x Units of production) + Fixed cost $61,500 = ($15 x 2,100) + Fixed cost $61,500 = ($15 x 2,100) + $30,000
High-Low Method Actual costs incurred Variable cost per unit = $15 Production Total (Units) Cost The fixed cost is the same at the lowest level. June 1,000 $45,550 July 1,500 52,000 August 2,100 61,500 September 1,800 57,500 October 750 41,250 Total cost = (Variable cost per unit x Units of production) + Fixed cost $41,250 = ($15 x 750) + Fixed cost $41,250 = ($15 x 750) + $30,000
Unit costs remain the same per unit regardless of activity. Total costs increase and decreases with activity level. Unit costs remain the same regardless of activity. Total costs increase and decreases proportionately with activity level. Variable Costs Fixed Costs Total Variable Costs Total Fixed Costs Total Costs Total Costs Total Units Produced Review Total Units Produced Unit Fixed Costs Unit Variable Costs Per Unit Cost Per Unit Cost Total Units Produced Total Units Produced
Cost-Volume-Profit Relationships
Contribution margin Income from Operations FIXED COSTS Contribution Margin Income Statement The contribution margin is available to cover the fixed costs and income from operations. Sales (50,000 units) $1,000,000 Variable costs 600,000 Contribution margin $ 400,000 Fixed costs 300,000 Income from operations $ 100,000
Sales (50,000 units) $1,000,000 Variable costs 600,000 Contribution margin $ 400,000 Fixed costs 300,000 Income from operations $ 100,000 Variable costs Contribution margin Sales – = Contribution Margin Income Statement
Sales – Variable costs Sales $1,000,000 – $600,000 $1,000,000 Contribution margin ratio = 40% Contribution margin ratio = Contribution Margin Ratio Sales (50,000 units) $1,000,000 Variable costs 600,000 Contribution margin $ 400,000 Fixed costs 300,000 Income from operations $ 100,000 100% 60% 40% 30% 10% Contribution margin ratio =
Contribution Margin Ratio Sales (50,000 units) $1,000,000 Variable costs 600,000 Contribution margin $ 400,000 Fixed costs 300,000 Income from operations $ 100,000 100% 60% 40% 30% 10% $20 12 $ 8 The contribution margin can be expressed three ways: 1. Total contribution margin in dollars. 3. Contribution margin ratio (percentage). 3. Unit contribution margin (dollars per unit).
Revenues Costs = Break-even What is the break-even point?
Calculating the Break-Even Point Sales (? units) $ ? Variable costs ? Contribution margin $ 90,000 Fixed costs 90,000 Income from operations $ 0 $25 15 $10 At the break-even point, fixed costs and the contribution margin are equal.
Fixed costs $90,000 Calculating the Break-Even Point In Units Sales ($25 x 9,000) $225,000 Variable costs ($15 x 9,000) 135,000 Contribution margin $ 90,000 Fixed costs 90,000 Income from operations $ 0 Sales ($25 x ? units) $ ? Variable costs ($15 x ? units) ? Contribution margin $ 90,000 Fixed costs 90,000 Income from operations $ 0 $25 15 $10 Break-even sales (units) = Unit contribution margin = $10 9,000 units =
Fixed costs $840,000 Calculating the Break-Even Point In Units Sales ($250 x ? units) $ ? Variable costs ($145 x ? units) ? Contribution margin $ ? Fixed costs 840,000 Income from operations $ 0 $250 145 $105 8,000 units Break-even sales (units) = $105 Unit contribution margin The unit selling price is $250 and unit variable cost is $145. Fixed costs are $840,000.
Fixed costs $840,000 Calculating the Break-Even Point In Units Next, assume variable costs is increased by $5. Sales ($25 x ? units) $ ? Variable costs ($15 x ? units) ? Contribution margin $ ? Fixed costs 840,000 Income from operations $ 0 $250 145 $105 $250 150 $100 8,400 units Break-even sales (units) = $100 Unit contribution margin The unit selling price is $250 and unit variable cost is $145. Fixed costs are $840,000.
Fixed costs $600,000 Calculating the Break-Even Point In Units $50 30 $20 Sales $ ? Variable costs ? Contribution margin $ ? Fixed costs $600,000 Income from operations $ 0 30,000 units Break-even sales (units) = $20 Unit contribution margin A firm currently sells their product at $50 per unit and it has a related unit variable cost of $30. The fixed costs are $600,000.
Fixed costs $600,000 Calculating the Break-Even Point In Units Management increases the selling price from $50 to $60. $60 30 $30 $50 30 $20 Sales $ ? Variable costs ? Contribution margin $ ? Fixed costs $600,000 Income from operations $ 0 20,000 units Break-even sales (units) = $30 Unit contribution margin
Target Profit In Units Sales (? units) $ ? Variable costs ? Contribution margin $ ? Fixed costs 200,000 Income from operations $ 0 $75 45 $35 Fixed costs are estimated at $200,000, and the desired profit is $100,000. The unit selling price is $75 and the unit variable cost is $45. The firm wishes to make a $100,000 profit.
Fixed costs + target profit Target Profit In Units Sales (? units) $ ? Variable costs ? Contribution margin $ ? Fixed costs 200,000 Income from operations $ 0 $75 45 $30 10,000 units $200,000 + $100,000 Sales (units) = Unit contribution margin $30
Target Profit Sales (10,000 units x $75) $750,000 Variable costs (10,000 x $45) 450,000 Contribution margin $300,000 Fixed costs 200,000 Income from operations $100,000 $75 45 $30 Proof that sales of 10,000 units will provide a profit of $100,000.
Total Sales Variable Costs Cost-Volume-Profit Chart $500 $450 $400 $350 $300 $250 $200 $150 $100 $ 50 Sales and Costs ($000) 60% 0 1 2 3 4 5 6 7 8 9 10 Units of Sales (000) Unit selling price $ 50 Unit variable cost 30 Unit contribution margin $ 20 Total fixed costs $100,000
Contribution Margin 100% 60% 40% Cost-Volume-Profit Chart $500 $450 $400 $350 $300 $250 $200 $150 $100 $ 50 40% Sales and Costs ($000) 60% 0 1 2 3 4 5 6 7 8 9 10 Units of Sales (000) Unit selling price $ 50 Unit variable cost 30 Unit contribution margin $ 20 Total fixed costs $100,000
Fixed Costs 100% 60% 40% Cost-Volume-Profit Chart $500 $450 $400 $350 $300 $250 $200 $150 $100 $ 50 Total Costs Sales and Costs ($000) 0 1 2 3 4 5 6 7 8 9 10 Units of Sales (000) Unit selling price $ 50 Unit variable cost 30 Unit contribution margin $ 20 Total fixed costs $100,000
Break-Even Point 100% 60% 40% Cost-Volume-Profit Chart $500 $450 $400 $350 $300 $250 $200 $150 $100 $ 50 Sales and Costs ($000) 0 1 2 3 4 5 6 7 8 9 10 Units of Sales (000) Unit selling price $ 50 Unit variable cost 30 Unit contribution margin $ 20 Total fixed costs $100,000 $100,000 $20 = 5,000 units
Operating Profit Area Operating Loss Area 100% 60% 40% Cost-Volume-Profit Chart $500 $450 $400 $350 $300 $250 $200 $150 $100 $ 50 Sales and Costs ($000) 0 Units of Sales (000) Unit selling price $ 50 Unit variable cost 30 Unit contribution margin $ 20 Total fixed costs $100,000
Profit-Volume Chart
$100 $75 $50 $25 $ 0 $(25) $(50) $(75) $(100) Operating Profit (Loss) $000’s Relevant range is 10,000 units 1 2 3 4 5 6 7 8 9 10 Units of Sales (000’s) Sales (10,000 units x $50) $500,000 Variable costs (10,000 units x $30) 300,000 Contribution margin (10,000 units x $20) $200,000 Fixed costs 100,000 Operating profit $100,000
Profit Line Maximum profit within the relevant range. Maximum loss is equal to the total fixed costs. $100 $75 $50 $25 $ 0 $(25) $(50) $(75) $(100) Operating profit Operating Profit (Loss) $000’s Operating loss 1 2 3 4 5 6 7 8 9 10 Units of Sales (000’s) Sales (10,000 units x $50) $500,000 Variable costs (10,000 units x $30) 300,000 Contribution margin (10,000 units x $20) $200,000 Fixed costs 100,000 Operating profit $100,000
Break-Even Point $100 $75 $50 $25 $ 0 $(25) $(50) $(75) $(100) Operating profit Operating Profit (Loss) $000’s Operating loss 1 2 3 4 5 6 7 8 9 10 Units of Sales (000’s) Sales (10,000 units x $50) $500,000 Variable costs (10,000 units x $30) 300,000 Contribution margin (10,000 units x $20) $200,000 Fixed costs 100,000 Operating profit $100,000
Products A B Sales $ 90 $140 Variable costs 70 95 Contribution margin $ 20 $ 45 Sales mix 80% 20% Cascade Company sold 8,000 units of Product A and 2,000 units of Product B during the past year. Cascade Company’s fixed costs are $200,000. Other relevant data are as follows:
$25 Sales Mix Considerations Products A B Sales $ 90 $140 Variable costs 70 95 Contribution margin $ 20 $ 45 Sales mix 80% 20% Product contribution margin $16 $ 9 Fixed costs, $200,000
$200,000 $25 $25 Sales Mix Considerations Products A B Product contribution margin $16 $ 9 Break-even sales units Fixed costs, $200,000
Break-even sales units $200,000 $25 $25 Sales Mix Considerations Products A B Product contribution margin $16 $ 9 = 8,000 units Fixed costs, $200,000
$25 Sales Mix Considerations Products A B Product contribution margin $16 $ 9 A:8,000 units x Sales Mix (80%) = 6,400 B:8,000 units x Sales Mix (20%) = 1,600
Product A Product B Total Sales: 6,400 units x $90 $576,000 $576,000 1,600 units x $140 $224,000 224,000 Total sales $576,000$224,000$800,000 Variable costs: 6,400 x $70 $448,000 $448,000 1,600 x $95 $152,000 152,000 Total variable costs $448,000$152,000$600,000 Contribution margin $128,000 $ 72,000 $200,000 Fixed costs 200,000 Income from operations $ 0 Break-even point PROOF