+30
Economic Expectations Europe. March 2014. Indicator > +20 Indicator 0 to +20 Indicator 0 to -20 Indicator < -20 European Union total : +18. +31. +30. +18. +19. +33. +8. -5. -11. -17. -21. +23. +1. -43. -2. -32.

+30
E N D
Presentation Transcript
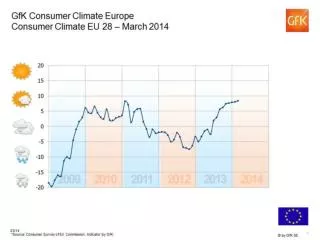
EconomicExpectationsEurope March 2014 Indicator > +20 Indicator 0 to +20 Indicator 0 to -20 Indicator < -20 European Union total: +18 +31 +30 +18 +19 +33 +8 -5 -11 -17 -21 +23 +1 -43 -2 -32 *Source: Consumer Survey of EU Commission, Indicator by GfK.
IncomeExpectationsEurope March 2014 Indicator > +20 Indicator 0 to +20 Indicator 0 to -20 Indicator < -20 European Union total: +3 +10 -4 +29 +26 +46 +14 +10 -33 -8 -14 +1 +1 -43 -23 -29 *Source: Consumer Survey of EU Commission, Indicator by GfK.
Willingness-to-buyEurope March 2014 Indicator > +20 Indicator 0 to +20 Indicator 0 to -20 Indicator < -20 European Union total: +1 -11 -16 -17 +2 +56 -4 +9 -27 -14 -15 -10 +14 -43 -33 -26 *Source: Consumer Survey of EU Commission, Indicator by GfK.