Download
1 / 117
1.17k likes | 1.28k Vues
Uncover how to navigate WISEdash, analyze school data, and kickstart School Improvement Planning at the WISExplore Data Retreat. Learn new tools for intervention, support, and innovation. Dr. Jerry Weast welcomes you to this insightful data-driven journey!

E N D
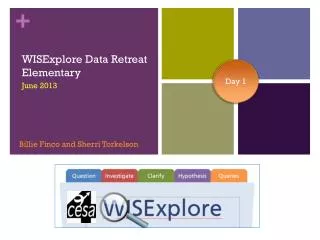
Day 1 Billie Finco and Sherri Torkelson WISExplore Data RetreatMiddle School June 2013
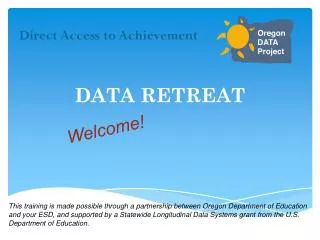
Used well, monitoring tools are not just for outside agencies or leaders, but for students, teachers, principals and parents, too. These tools let us know when the students are on the right path and at the right pace. The right data systems illuminate what to fix. They let us know when we need to intervene with training or support or where we need to craft a new solution to innovate. Dr. Jerry Weast
Welcome! • Logistics • Introductions • Materials and Resources • Schedule
WISExplore Retreat Materials • Original WISExplore Retreat materials are posted in LiveBinder. • Go to www.livebinders.com/play/play/899070 (password: wisexplore)
Our Objectives • Learn how to navigateWISEdash • Use WISEdash to analyze school data • Be introduced to the WISExplore e-learning Modules • Begin the School Improvement Planning process
Agenda Day One Day Two • Opening • Data Inquiry Process • WSAS Dashboard Inquiry • Growth Dashboard Inquiry • Attendance Dashboard Inquiry • Access Dashboard Inquiry • Plan Next Steps
Norms • Stay engaged • Focus on uncovering/discovering/recovering • Use technology respectfully • Strive for equity of voice
Security and Confidentiality • Roles of staff and levels of security
Documenting Work During The Retreat • In the past …
Moving to the Digital Age • Using an electronic “Fillable Form” • Eventually, the Data Inquiry Process will be embedded within the Data Warehouse for easy use. • Note: • The current Fillable Form will not function effectively on a MAC computer or iPad.
Using Data to Support Continuous Improvement • The “wait” to see how students achieved is too late to make important programmatic and instructional shifts to help students responsively • Shift in Federal Requirements • External accountability shifts to more “high-stakes” • Educator Effectiveness drives ownership of student achievement • Shifting data sources allow for more immediate & ongoing access • WISEdash • Your local interim assessments • Ongoing collaborative data work is needed to drive continuous improvement • Teacher PLC teams • School Improvement teams
So how do we move the needle on student achievement? Increased Accountability More Rigorous Assessments Higher Standards
Reconnect to Your Data Reality • Access your school report card online in SAFE • Locate the following two documents:
As you consider last year’s reality… What are you wondering about this year’s data?
As you consider last year’s reality… What are you wondering about this year’s data?
As you consider last year’s reality… What are you wondering about this year’s data?
Part A Part B
As you consider last year’s reality… What are you wondering about this year’s data?
As you consider last year’s reality… What are you wondering about this year’s data?
Data Inquiry Process Data RetreatData Inquiry Process June 25, 2013 Finco & Torkelson
WISExplore Data Inquiry Process The data inquiry process … • Always begins with a meaningful question • Guides teams in intentional data work by providing focus • Can be applied to any data question • Leads to identifying possible root causes Finco & Torkelson
Question • Begin data inquiry by posing a question that is important to your school’s continuous improvement Finco & Torkelson
Pose a data question first because … • It provides a clear starting point • It is the first step in a process that will lead to clear goals • It will connect the data inquiry to the vision • It keeps you on track • It clarifies your purpose for data navigation • The process will be both efficient and effective Finco & Torkelson
Context for a Data Question Considerations when posing a data question: • Past performance • Current data results • Trends over time • Changes in … • the school community • school programs • standards What do I need to know? Finco & Torkelson
Categories of Data Questions • Grade level questions • Gap and subgroup questions • Change, progress and trend questions • General questions • Subject area and skill questions • Course, program questions • Achievement questions • Individual student questions Finco & Torkelson
Shaping Data Inquiry Questions BIG questions… • How does achievement compare across levels? Add “Filter” Language to Focus the Data Inquiry • How does math achievement on the WKCE compare in 7th and 8th grades for all students enrolled for a full academic year in Elm Grove Middle School during 2012-13? Add “Related Dashboard” Language for Subgroup Comparisons • How does math achievement on the WKCE compare in 7th and 8th grades for students with disabilities as compared with nondisabled students enrolled for a full academic year in Elm Grove Middle School during 2012-13? Finco & Torkelson
Investigate • Based on the data inquiry question, navigate the appropriate dashboard to locate the data picture that best answers your question. Finco & Torkelson
Navigation: Functionality “Must-Knows” • Managing layers • Selecting and copying • Exporting • pdfs • Excel • ms word • Saving to favorites • Recalling favorites • Dashboards • Filtering and clearing filters • Related Dashboards • Hovering • Opening up student lists • Sorting student lists • Individual Student Profiles Finco & Torkelson
ClarifyDocumenting data observations, stating specific data findings, trends and gaps • Remembering the Data Inquiry Question, view the data picture to shape the team’s observations • Observe the data, refine and state critical data findings with supporting details. Finco & Torkelson
Data Findings • With the Inquiry Data Question in mind, describe the data findings. • What do you see in the data picture? What patterns do you observe? Well-written data findings: • Are objective – just facts, not opinions or questions • Are precise (include the data) • Are statements (complete sentences) understandable by stakeholders • Include the test type and subject • Include the timeframe for the findings • Include the specific group of students Finco & Torkelson
Sample Data Findings No! Non-Examples of Data Findings • Our kids didn’t do well in reading. • The special ed students went down. • There are so many students in the red – why? Examples of Data Findings Related to the Data Question • In 8th grade Reading on the fall 2012 WSAS, over half (54%) of SwD scored in the minimal category, while only 11% of Students Without Disabilities scored at that same level. • 58.5% of Students Without Disabilities were below proficient, compared to 85.7% of Students With Disabilities below proficient in reading in fall 2012 on the same test. Yes! Finco & Torkelson
HypothesizeExamine your system • What practices, policies or procedures might be producing these results? Finco & Torkelson
Hypotheses of Practice • Posing educated guesses about school or classroom practices as possible underlying root causes for critical data findings. Finco & Torkelson
Posing Hypotheses of Practice Finco & Torkelson • Take quiet time to think about all of the causes for the data pattern. • Translate each “cause” into a “hypothesis of practice”. • Hypotheses of practice … • Are our best educated guesses about what “we” are doing or not doing that could be contributing to the results • Are guided by the data findings • Are shaped by both perceptions of practices and professional experiences in the school • Are guided by research-based practices • Never place blame on student or family characteristics, or any other unalterable factors