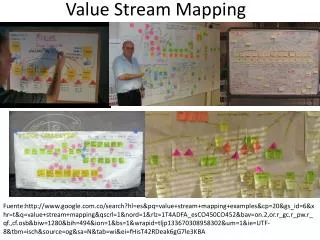
Chapter 5 Value Stream Mapping
Chapter 5 Value Stream Mapping. 5 Principles of LEAN. Mapping the value stream. Following the product or product family from beginning to end (really from end to beginning). Each value-added and non-value added step is noted and timed What does value added mean?. What is value added?.

Chapter 5 Value Stream Mapping
E N D
Presentation Transcript
Mapping the value stream • Following the product or product family from beginning to end (really from end to beginning). • Each value-added and non-value added step is noted and timed What does value added mean?
What is value added? • Value added (VA) activities are those that customer is willing to pay for. (Also called customer value-added CVA). They transform the product service or transaction in a way that is meaningful to the customer. Examples? • Non-value-added (NVA) are all those activities required by a business to execute work that adds no value from a customer point of view and that customers are not willing to pay for. Examples?
Should all NVA steps be eliminated? • What about: • Equipment maintenance? • Janitor service? • Payroll? Internal audit? Budget forecasting… • These don’t add-value to the customer, but are necessary for the functioning of the business. • So really there are 3 types of steps in a value stream: • Steps that create value • Steps that create no value but are necessary • Steps that create no value and therefore can be eliminated.
Traditional vs. Waste elimination approach Total lead-time through Value Stream Value Added Muda (waste) and non value added activities. Make value added twice as fast Traditional improvement focus Muda (waste) and non value added activities. Value Added Waste elimination focus Value Added Muda (waste) and non value added activities. Reduce wasted time
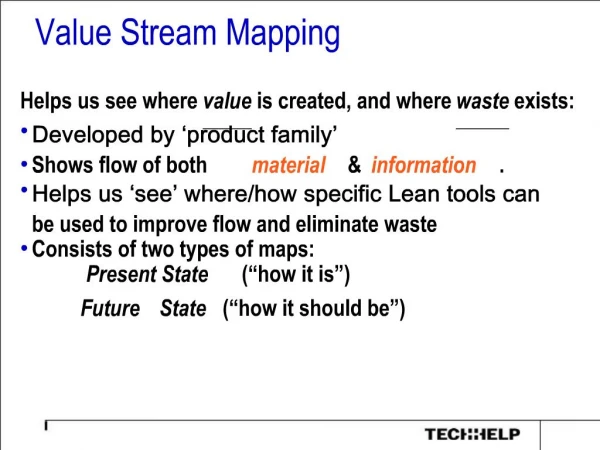
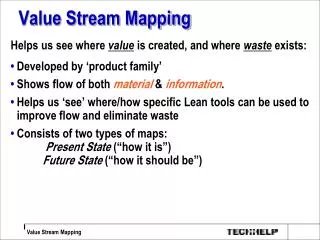
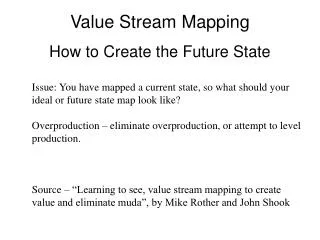
So what is Value Stream Mapping? • Value stream mapping is a tool that helps you see and understand the flow of material and information as a product/service makes its way through the value stream. • Usually a pencil and paper process at first. • Carefully draw a visual representation of every process in the material and information flow. • Then ask a set of key questions and draw a “future state” map of how value should flow.
Why is VSM an essential tool? “The real voyage of discovery consists not in making new landscapes but in having new eyes.” –Marcel Proust (1871-1922), Novelist • Helps you visualize more than just the single-process level, you can see the whole flow. • Helps you see more than waste, and identify the sources of waste. • Makes decisions about the flow apparent • It forms the basis of an implementation plan. Value stream maps become a blueprint for lean implementation. • Show the link between the information flow and the material flow. • Is a qualitative and quantitative tool by which you describe in detail how your facility should operate in order to create flow.
Mapping the Current State • Draw by hand and pencil • Try to collect current information • Check for integrity of the data • Start at the end and work upstream • Bring your stopwatch to perform needed or missing time and motion studies • Do the value stream yourself (walk the floor) • Should be one person • Map material & information flows
Production flow After Value Stream mapping the next step LEAN step is flow. Flow produces a product without unnecessary interruption or delay.
Key concept…Takt Time • “Pace” of customer demand • *Minus lunch breaks, briefings, other… • Can also apply to transactions, services, or parts • Can be defined in terms of per day, month, or other metric. • Creates a sense of urgency, without it everyone will produce at their own schedule. • As soon as the customer demand is determined, the organization must make the commitment to meet it.
Takt Time Example • Customer demand is 100 widget’s/ day • Production time available/day = 8 hours – 480 minutes • Lunch – 45 minutes/day • Breaks – 30 minutes TAKT TIME= In order to meet customer demand within available work time, we must produce a widget every 4.05 minutes. • If product is grouped, or batched then we can calculate Pitch Time PitchTime = Takt Time * batch size • If demand can’t be met with current resources and processes, Lean tools such as Buffer or Safety resources should be used.
Common VSM Symbols • There is some variation between software and companies. But on a whole very similar.(Book lists them on page 97.) • Typical Process data/ form: Cycle Time Production time Changeover time Uptime Chart from: http://www.edrawsoft.com/Value-Added-Flow-Chart.php
Example: Scorpion PB&J Factory • Daily demand of 700 pieces • With the following factory arrangement. • Hours per shift: 8 • Break minutes per shift: 30 • Shifts per day: 1 • Days per week: 5 CALCULATE: TAKT TIME Get out your pencil and a (big) piece of paper Example from http://lssacademy.com/2008/02/24/lets-create-a-current-state-value-stream-map/
Start the map with the customer Draw in the customer box / details. In the top right hand side of the paper we draw the little saw topped box representing our customer. We also note their monthly and/or daily demand along with the takt time as calculated in step 1.
Material Flow PROCESS: What would be the general steps needed? define the start and stop point of the process. • Peanut butter Application – 1 operator - 25 second cycle time • Jelly Application – 1 operator – 30 second cycle time • Packaging- 1 operator – 42 second cycle time • Shipping
Focus on the material flow first Start at the END of the process and begin drawing the map back to front. Focus on the material flow first. Focus on the material flow side of things first (bottom portion of the map). This includes the process boxes and data boxes.
Inventory • Before PB Application – 700 pieces • Before Jelly Application – 359 pieces • Before Packaging – 486 pieces • Before Shipping – 128 pieces (In our example, we chose to simply count two pieces of bread as one subassembly since they move together down the production line. Also, we are not accounting for the peanut butter and jelly “raw material” at this point. ) • During the walk through of the process we noticed that each process step seemed to be working in isolation. In other words, the lady working at the peanut butter application seemed to produce as many units as she could and then pushed them along to the jelly application process.
Add the Inventory/Wait Times. Once you have all the process and data boxes in, it’s time to add in inventory and/or waiting times. For inventory, we simply count the number of pieces in between the processes and note them under the triangle.
Information flow.. • We learned that production schedules each process step in isolation. In other words, each work station gets its unique production schedule. • Scorpion’s customer sends 30 days electronic forecasts as well as electronic daily orders. Conversely, Scorpion sends its bread supplier an electronic weekly forecast.
Draw in the information flow. If it is moves about electronically use a lighting bolt . If it is communicated manually use a straight arrowed line. During this step we also draw in our production control box.
Add in the timeline to the bottom of the value stream map. This saw tooth looking line helps us separate the value added cycle time (taken from data boxes) from the non value added time. The last step in the process is to sum up all the “value-add” cycle times and note them at the end of the timeline. Likewise, we also sum up the “inventory” times and note that on the timeline.
Calculating Total Lead Time • Queuing time - time that a “work unit” waits for a downstream process to begin work on it. • Cycle Time – the elapsed time for an individual activity from start to completion. • Total Cycle Time – Sum of all the cycle times for individual activities in the process in the value stream. Referred to as Value Added time (VAT) because it is the time during which value is added as the work unit flows through the process. Total Lead Time = Total Cycle time + Total Queuing time
Questions to think about • How many days of inventory do you have waiting between processes? • What is the total non-value added (or queuing) time? • What is the total cycle time? • Can the Scorpion PB&J factory meet the customer demand? How does the capacity relate to the takt time we calculated? • What is the “pacemaker” process? (the process that should set the pace for all the rest?) • What is wrong in this process flow? Use the 5 whys to identify opportunities for improvement.