Download
1 / 40
710 likes | 1.74k Vues
Natural History of Obesity Leading to Type 2 Diabetes. Complications. Onset of diabetes. Disability. Genetic susceptibility Environmental factors Nutrition Physical inactivity. IGT. Ongoing hyperglycemia. Obesity Insulin resistance. Death. Risk for Disease. Metabolic Syndrome.

E N D
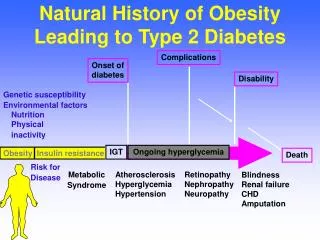
Natural History of Obesity Leading to Type 2 Diabetes Complications Onset ofdiabetes Disability Genetic susceptibility Environmental factors Nutrition Physical inactivity IGT Ongoing hyperglycemia Obesity Insulin resistance Death Risk for Disease Metabolic Syndrome AtherosclerosisHyperglycemiaHypertension RetinopathyNephropathyNeuropathy BlindnessRenal failureCHDAmputation
Obesity Trends* Among U.S. Adults(BMI ≥ 30 or ≈ 30 lbs overweight for 5’4” woman)
Prevalence (%) of overweight among children and adolescents Average 11 year old boy today is 11 pounds heavier than in 1973
National Longitudinal Survey of Youth Prospective Cohort Study of 8270 Children (4-12 years old) - 1999 Risk of Overweight Overweight > 85th %ile BMI > 95th %ile BMI African American 38.4% 21.5% Hispanics 37.9% 21.8% Caucasian 25.8% 12.3% Source: NHANES???
Secular Increases in Relative Weight and Adiposity in Children (5-14 years old)- Bogalusa Heart Study - * Change adjusted for height, age, race, and sex Source: Pediatrics 99:420-426, 1997
Correlations of Weight and BMI in Youth at 7.7 and 23.6 Years r=0.605 r=0.612 Source: Minneapolis Children’s BP Study, Circulation 99:1471, 1999
Relationship Between Prevalence of Overweight and Daily TV Hours Gortmaker et al., 1996
Overweight Children • Ate fewer fruits and vegetables (2.9 vs. 3.3/day) • Drank more sweetened beverages (1.3 vs. 1.1/day) • Ate more high-fat snacks (64 vs. 56 %; p=0.054) • Ate more fast food (1.4 vs. 1.1/week; p=0.051) • Spent more screen time (101 vs. 81 minutes) • Less likely take part in lessons on nutrition (50 vs. 64 percent). Special Report on Policy Implications from the 1999 California Children’s Healthy Eating and Exercise Practices Survey. The California Endowment. Rev. August 2002.
Pediatric Overweight AAP Policy Statement • Identify and track at risk youth • Calculate and plot BMI yearly • Promote health eating patterns • Fruits, vegetables, low-fat dairy, whole grains • Self-regulation of intake, limits on choices, modeling • Promote physical activity • Limit TV and video • Monitor changes in obesity-associated risk factors (BP, lipids, IGT, apnea, hyperinsulinism) Source: Pediatrics 112, August 2003
Metabolic SyndromePrevalence in 12-19 Year Olds • Overall 4.2% (6.1% M, 2.1% F) • BMI 95th percentile 28.0% • BMI 85th-94th percentile 6.8% • BMI < 85th percentile 0.1% Based on 1994 population estimates, 910,000 adolescents had metabolic syndrome. Source: Cook et al., Arch Pediatr Adolesc Med 157:821-827, 2003
Link Between Obesity and Type 2 Diabetes: Nurses’ Health Study
Number of Bariatric Surgeries 1992-2003 Surgery for Severe Obesity: US 1992 to 2003 NEJM March 11, 2004
GI Surgery for Severe Obesity Risk and Complications: • 10-20% require follow-up surgery • Abdominal hernia • Break down of staple line • Gallstones • 30% develop nutritional deficiency Cost: $20,000 to $50,000 Source: NIDDK Highest Increase Rate of all Pediatric Surgeries
Natural History of Obesity Leading to Type 2 Diabetes Complications Onset ofdiabetes Disability Genetic susceptibility Environmental factors Nutrition Physical inactivity IGT Ongoing hyperglycemia Obesity Insulin resistance Death Risk for Disease Metabolic Syndrome AtherosclerosisHyperglycemiaHypertension RetinopathyNephropathyNeuropathy BlindnessRenal failureCHDAmputation
Type 2 DiabetesA Progressive Disease Impaired glucose tolerance (IGT) Undiagnosed diabetes Known diabetes Insulin resistance Insulin secretion Postprandial glucose Fasting glucose Microvascular complications Macrovascular complications Adapted from Ramlo-Halsted BA, Edelman SV. Prim Care. 1999;26:771-789
Burden of Diabetes in USA • 18.2 Million Americans Have Diabetes • 5.2 Million Unaware of Diagnosis • 40 Million Americans Have Prediabetes • 239,000 Diabetes-Related Deaths/year • 2-to-6-Fold More Likely to Have Heart Disease • 2-to-4-Fold More Likely to Have a Stroke • 75% of All Diabetes Related Deaths Associated With Cardiovascular Disease • Cost $132 Billion/2002 • Mokdad, et al, JAMA 2001 286,1195
Diabetes and Gestational Diabetes Trends Among Adults in the United States, Behavioral Risk Factor Surveillance System, 1990, 1995 and 2001 1990 1993 2001
Diabetes Prevalence Among Minority Populations in the U.S. Percentage of each population with diabetes Non-Hispanic Whites Latinos African Americans 7.8% (11.4 million) 13% (2.8 million) 10.2% (2 million) 15.1% (105,000) Native Americans & Alaska Natives Centers for Disease Control and Prevention (CDC) 1999 www.cdc.gov/diabetes
The Changing Face of Diabetes in Youth 35 30 25 20 % with type 2 15 10 5 0 87 88 89 90 91 92 93 94 95 96 Cincinnati <19 years Little Rock 8-21 years San Antonio <19 years Source: Fagot-Campagna et al., J Pediatr 136:664-672, 2000
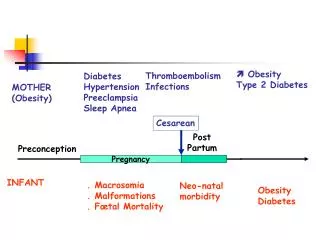
Diabetes Projected Risks:For Babies Born in 2000 Girls: 38% lifetime risk • If diabetic before age 40, Lifespan shortened by 14 years (Quality of life by 19 years) Boys: 33% lifetime risk • If diabetic before age 40, Lifespan shortened by 12 years. (Quality of life by 22 years) V Narayan et al: JAMA 8 Oct 2003
More than 135,000 GDM + 200,000 T2DM + 6,000 T1DM pregnancies annually Diabetes 8% Non-diabetes 92% Prevalence of Diabetes in Pregnancyin the United States of America American Diabetes Association. Diabetes Care. 1998;21(Suppl. 2).
ADA Goals for Glycemic Control • A1C < 7.0%* • Pre-prandial plasma 90-130 mg/dl glucose • Peak postprandial <180 mg/dl plasma glucose *Referenced to a non-diabetic range of 4.0-6.0% using a DCCT-based assay
Diabetes Care in the U.S.Improvement Needed • Data from NHANES III* and BRFSS** • Participants 18-74 years with DM • Results: Percent at Goal • A1C < 7.0 43% (>9.5, 18%) • LDL < 100 11% (>130, 58%) • BP < 140/90 66% • Dilated eye exam 63% • Foot exam 55% • * Nat’l Health & Nutrition Exam Survey • ** Behavioral Risk Factors Surveillance Study
Majority of Patients with Diabetes are Not at ADA HbA1c Goal <7%
Census Bureau Projections 2000-2050 • Census Bureau projects population will grow 47% by 2050 • By 2050, there will be 112% more diagnosed cases of diabetes • Serious diabetes complications are projected to increase 137-189% by 2050 Diabetes 50 (Suppl 2): A205, 2001
GLOBAL PROJECTIONS FOR THE DIABETES EPIDEMIC: 2003-2025 (millions) World 2003 = 194 million 2025 = 333 million Increase 72%
Age Adjusted Prevalence of CVD 1997-2002
Coronary Heart Disease Mortality in Type 2 Diabetes Men Women 60 60 Diabetes Diabetes 50 50 No Diabetes No Diabetes 40 40 Mortality Rate per 1000 Mortality Rate per 1000 30 30 20 20 10 10 0 0 0-3 4-7 8-11 12-15 16-19 20-23 0-3 4-7 8-11 12-15 16-19 20-23 Duration of Follow-up (yr) Duration of Follow-up (yr) Krowlewski AS, et al Am J Med 1991; 90 (suppl2A):56S-61S.
25 25 20 20 15 15 10 10 5 5 0 0 A1CPredicts CV Risk in Type 2 DiabetesKuusisto et al 229 Finnish Patients Followed for 3.5 Years CHD mortality All CHD events Incidence (%) over 3.5 years † * Low<6% Middle6.0%–7.9% High>7.9% Low<6% Middle 6.0%–7.9% High>7.9% A1C tertile CHD=coronary heart disease *P<0.01 vs lowest tertile; †P<0.05 vs lowest tertile Kuusisto J et al. Diabetes. 1994;43:960-967
% Risk Reduction Lancet 1998; 352: 837-853 UKPDS - Glycemic Control Risk Reductions
UKPDS - BP Control Risk Reductions Any Diabetes Related Endpoint Deaths Related to Diabetes 24% Risk Reduction 32% Risk Reduction Events/ 1000 pt-years p=0.0046 p=0.0019 n=1148 UKPDS. BMJ 1998 317: 703-713
% of Patients with a Major Coronary Event 55% Risk Reduction 32% Risk Reduction Nondiabetic Patients n=4242, p<0.00001 Diabetic Patients n=201, p=0.002 Pyorala et al, Diabetes Care 1997; 20: 614 4S Study: Effect of Simvastatin on Coronary Events - 6 years
Prevention of T2D withLifestyle Intervention(N=523 with IGT, mean age 55, BMI 31) Incidence of diabetes reduced 58% (p=.0003). * diet, exercise, frequent visits ** yearly advice Source: Tuomilehto et al., ADA 2000
Type 2 Diabetes Prevention Percent developing diabetes All participants All participants Risk reduction 31% by metformin 58% by lifestyle Placebo 40 30 Metformin Cumulative incidence (%) 20 Lifestyle 10 0 0 1 2 3 4 Years from randomization The DPP Research Group, NEJM 346:393-403, 2002
School-based Program to Decrease Soda Consumption • 644 children (7-11 years old), 6 schools • Program to decrease regular and diet soda intake delivered in 1-hour sessions 4 times per year Source: James et al., Brit Med J 328:1237, 2004
Natural History of Obesity Leading to Type 2 Diabetes Complications Onset ofdiabetes Disability Genetic susceptibility Environmental factors Nutrition Physical inactivity IGT Ongoing hyperglycemia Obesity Insulin resistance Death Risk for Disease Metabolic Syndrome AtherosclerosisHyperglycemiaHypertension RetinopathyNephropathyNeuropathy BlindnessRenal failureCHDAmputation