
SlideServe
Menu
Préférences
© SlideServe · v2026

Understanding Graphs: Types, Construction, and Appropriate Usage

hyatt-dotson avatar
15 diapositives · 307 Views · Nov 15, 2014

Data collected in experiments is often more effectively presented through graphs than text or tables. Graphs provide a clear visual representation of data, making it easier to understand trends and relationships. This presentation covers three main types of graphs: line graphs, bar graphs, and pie graphs. You'll learn when to use each type, how to construct them, and how to appropriately label axes. Enhancing your ability to visualize data is essential for effective communication in scientific research and analysis.
Understanding Graphs: Types, Construction, and Appropriate Usage - slide 1
01 / 15Understanding Graphs: Types, Construction, and Appropriate Usage
1 / 17

Télécharger la présentation

Understanding Graphs: Types, Construction, and Appropriate Usage
Une image / un lien ci-dessous est fourni (tel quel) pour télécharger la présentation

Politique de téléchargement : le contenu du site vous est fourni TEL QUEL pour votre information et votre usage personnel ; il ne peut être vendu, concédé sous licence ni partagé sur d’autres sites sans l’accord de son auteur.Le contenu vous est fourni TEL QUEL, pour votre information et votre usage personnel uniquement. Téléchargez la présentation en cliquant sur ce lien. Lors du téléchargement, si vous ne parvenez pas à télécharger une présentation, l’éditeur a peut-être supprimé le fichier de son serveur.Pendant le téléchargement, si vous ne parvenez pas à obtenir une présentation, le fichier a peut-être été supprimé par l’éditeur.

F I N

Plus de contenu associé

Transcription de la présentation
  1. Graphs

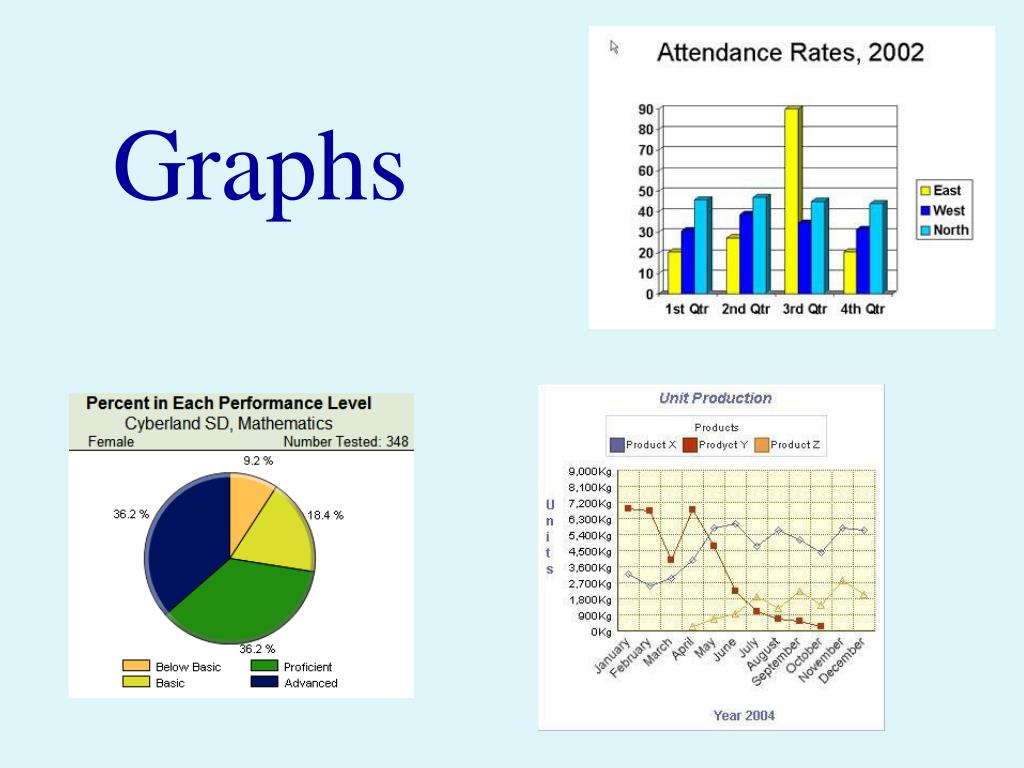
  2. Purpose Of a Graph Data collected in an experiment is often presented in the form of a graph. It is easier to interpret a graph than to read text or look at a table because a graph gives you a concise picture of your data. There are many types of graphs. This presentation introduces you to three: line graph, bar graph, and pie graph, and will help you decide which graph is the most appropriate for your data.

  3. Types of Graphs Bar - Pie/Circle - Line -

  4. Bar

  5. Line

  6. Pie/Circle

  7. Which Graph to Use? Line graphs- show changes in a chosen variable; generally it is used if you are measuring a dependent variable and an independent variable. Bar Graphs – are used for data that represents separate groups or categories showing the differences between the groups. Pie Graphs – are used to represent part-to-whole relationships.

  8. Constructing a Line Graph • Identify the variable. • Determine the scale for the X and y axis. • Number each scale. • Title each scale (include the unit of measure when ever possible). • Plot the points of your data. • Determine if the points will be connected. • Title your graph.

  9. Determine the scale for the X and Y axis The numbers used for the x and y axis must be the same distance apart. Example 1,2,3,4,5, or .5, 1, 1.5, 2, 2.5 100, 200, 300, 400 The scale does not have to be the same for the x and y axis.

  10. The scale used will depend on the measurements taken. Example: Numbers taken- .75, 1.2 , 2, 3, 3.9, 4.6 Scale – 0, .5 , 1, 1.5, 2, 2.5, 3, 3.5, 4, 4.5, 5 Numbers taken -150, 175, 205, 240, 300 Scale – 50, 100, 150, 200, 250, 300, 350

  11. Number Each Axis (The units do not have to be the same) 10 20 30 40 50 60 0 1 2 3 4 5 6 7 8 9 10 11

  12. Title Each Axis(include the unit of measure when ever possible) 10 20 30 40 50 60 Time in seconds 0 1 2 3 4 5 6 7 8 9 10 11 kgm

  13. Plot the Points of Your Data Time in seconds 10 20 30 40 50 60 0 1 2 3 4 5 6 7 8 9 10 11 kgm

  14. Determine if the points will be connected.Connect the points, if there is information happening between the points. (Sometimes points are connected to make it visually easier to read your are not suppose to do this.) Time in seconds 10 20 30 40 50 60 0 1 2 3 4 5 6 7 8 9 10 11 kgm

  15. Title your graph Roller blades and Mass Time in seconds 10 20 30 40 50 60 0 1 2 3 4 5 6 7 8 9 10 11 kgm