Download
1 / 55
580 likes | 1.01k Vues
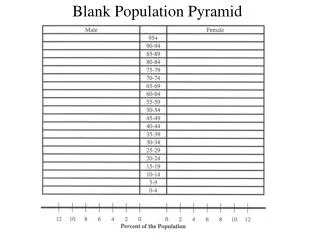
OLD DEPENDANTS ECONOMICALLY ACTIVE YOUNG DEPENDANTS. Population in Five Year Age bands. FEMALES To the right. MALES To the left. The population pyramid displays the age and sex structure of a country or given area. Usually, but not always, in % to make for easier comparisons

E N D
OLD DEPENDANTS ECONOMICALLY ACTIVE YOUNG DEPENDANTS Population in Five Year Age bands FEMALES To the right MALES To the left The population pyramid displays the age and sex structure of a country or given area Usually, but not always, in % to make for easier comparisons between countries
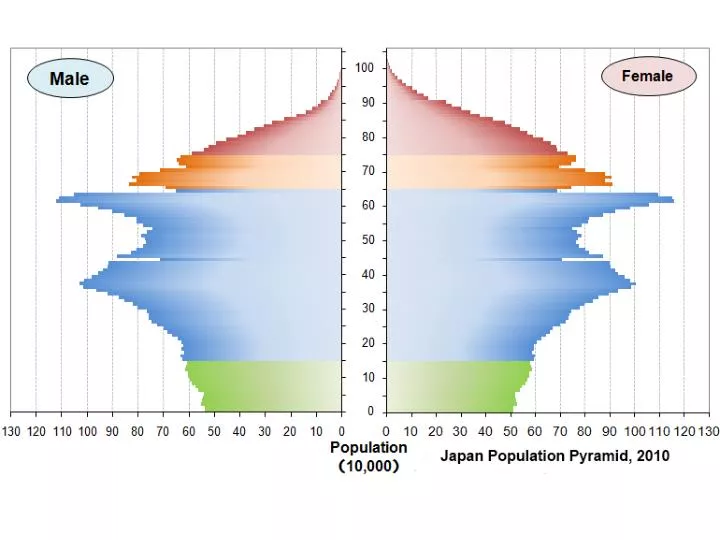
Note: x axis here is total persons not percentage of population
Shape of the sides shows death rate:concave sides=high death rateconvex sides=low death rate Angola Israel
Mexico’s “other” pyramidsleft: 1980 right: 2010 Concave to convex=death rates falling(this is Mexico entering what DTM stage?)
Width of base relates to birth rate (CBR) and fertility rate (TFR) Benin Netherlands
Base narrowing=falling birth rates(The first two pyramids shows South Korea moving through what stages of the DTM?)What stage does the last pyramid show?
Height of pyramid can indicate life expectancy (ignoring very thin tips) Japan Afghanistan
Irregularities or “kinks” in the sides indicate some demographic anomaly that caused rapid birth or death rates. India (not kinky) Russia (kinky)
Canada had an even more pronounced baby boom after WWII than the U.S. Note when the baby boomers reached reproductive age they created a baby “boomlet”.
WWI + Russian Civil War Stalin Famines WWII WWII “echo” and Urbanization Echo of the echo Declining TFR
Mao: “strength in numbers” “Great Leap Forward” One Child Policy
Contraception is anti-Islamic Contraception is ok after all
Population Pyramids related to the Demographic Transition Model Stage 1 Stage 2 Stage 3 Stage 4 IMPLICATIONS IMPLICATIONS IMPLICATIONS IMPLICATIONS Both birth rates and Death rates are High, so population growth rates are slow but population Is usually restored Due to high birth Rate. Short life Expectancy EXAMPLES: Afghanistan, Ivory Coast Population continues to grow but at slower rate. Low C Death Rate. Dramatically declining Crude Birth Rate. EXAMPLES: Ireland, China, New Zealand Low Crude Birth Rate and Crude Death Rate Higher dependency ratio and longer life expectancy Crude Death Rate does Rise slightly because of The ageing population EXAMPLES: United States, Japan Population starts to grow at an exponential rate due to fall in Crude Death Rate. More living In middle age. Life expectancy rises Infant mortality rate falls. EXAMPLES: Jordan, Thailand There is some merit in including or considering a Stage 5 today with a declining population
Shape: classic pyramidCape Verde: stage 2 in DTMBecause of mid-20th century famines, Cape Verde was one of last countries on earth to enter stage 2.
Shape: half ellipseChile: stage 3 in DTMChile moved into stage 2 (lowered death rates) in 1930’s and stage 3 (lowered birth rates due to family planning policies and bad economy) in the 1960’s
Shape: chimneyDenmark: stage 4 in DTMDenmark has been in stage 4 showing little population growth since the 1970’s.
The two “billionaires”:China has suffered more cataclysmic demographic events than India. But looking past the “kinks”, what shape is China’s pyramid trending towards?
Now it’s your turn:1) Working with a partner, analyze the 12 population pyramids on the back of your handout.2) In the table provided, match the letter below the pyramid with the region or place it describes.