Download
1 / 32
320 likes | 484 Vues
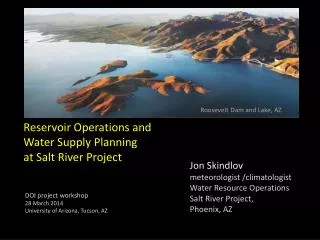
Roosevelt Dam and Lake, AZ. Reservoir Operations and Water Supply Planning at Salt River Project. Jon Skindlov meteorologist /climatologist Water Resource Operations Salt River Project, Phoenix, AZ. DOI project workshop 28 March 2014 University of Arizona, Tucson, AZ.

E N D
Roosevelt Dam and Lake, AZ Reservoir Operations and Water Supply Planning at Salt River Project Jon Skindlov meteorologist /climatologist Water Resource Operations Salt River Project, Phoenix, AZ DOI project workshop 28 March 2014 University of Arizona, Tucson, AZ
Salt River Project Established 1903 A Federal reclamation project A private corporation Delivers almost 1 million acre-feet per year Established 1937 as a political subdivision of the state of Arizona 32,452 million kWh sold in FY13 969,000 customers in and around the Phoenix metro area SRP Agricultural Improvement and Power District Salt River Valley Water Users Association
Phoenix Superstition Mtns. WATER Salt River --Reliable Supply --Drought --Flood Roosevelt Dam and Lake Looking west, late winter 2008
Colorado River Storage Capacity Lake Powell 24.4 maf Total System (Upper and Lower Colorado) 59.2 maf Lake Mead 26.3 maf SRP lakes 2.3 maf
Las Vegas Salt/Verde watershed area (13,000 sq mi) SRP… Manages 4 reservoirs on the Salt River, 2 on the Verde River and 1 on East Clear Creek; Operates approximately 260 groundwater wells; Delivers nearly 1 million acre-feet of water per year to the 250,000 acre SRVWUA service area. Mogollon Rim Salt River CAP
Salt/Verde watershed area (13,000 sq mi) CAP CAP canal “metro area” SRVWUA area (375 sqmi: 250,000 acres) 40 miles
6720’ - 1891’ - 2100’ - - 2000’ 2151’ Top of Conservation 1610.5’ - 1506’ - - 1748’ Salt River Project Reservoir System RooseveltDam C.C. CraginDam 2218’ Top of Safety of Dams East Clear Creek Storage: 15,000 AF 6720’ C.C. Cragin15,000 AF Roosevelt Lake 1,653,043 AF Horseshoe Dam Horse Mesa Dam 2026’ Horseshoe 109,217 AF 1914’ Bartlett Dam Apache Lake 245,138 AF Mormon Flat Dam 1798’ Bartlett 178,186 AF Stewart Mountain Dam 1660.5’ Verde River Storage: 287,403 AF 1529’ Canyon Lake 57,852 AF Saguaro Lake 69,765 AF SALT CONSERVATION STORAGE: 2,025,798 AF VERDE CONSERVATION STORAGE: 302,403 AF Total Conservation Storage: 2,328,201 AF 01/09/07 REF/SVRSCIAF-8
1971-2000 WINTER (build supply): Precip. (Dec-Mar): 6.3 in Runoff (Dec-May): 665 Kaf SUMMER (meet demand): Precip. (Jul-Sep): 6.8 in Runoff (Jul-Sep): 120 Kaf
100 90 80 70 60 50 40 30 20 10 0 1890 1900 1910 1920 1930 1940 1950 1960 1970 1980 1990 2000 2010 Salt River Project Historic Drought Periods (Average Runoff 1913–2010 = 1,198,536 AF) Longer Period Of Sustained Drought 7 Years1942 - 194862% 4 Years1974 - 197752% 19+Years1995 – 2014???% 5 Years1953 - 195747% % Average 7 Years1898 - 190435% Year
DRY WET DRY WET DRY 1892-1904: 2 wet, 11 dry 1905-45: 28 wet, 13 dry 1946-64: 5 wet, 14 dry 1996-2013: 4 wet, 14 dry 1965-95: 19 wet, 12 dry
What is Normal? 15 years above 1,000,000 acre-feet 11 years below 500,000 acre-feet
Creating Dependability from Variability From 2001-2010 total demand: 785 to 910 kaf
Change in Agricultural Water Use 1975 1955 PHX PHX Pop. 0.5 M Pop. 1.3 M 1990 2008 PHX PHX Pop. 2.1 M Pop. 4.0 M Salt River Water Users Association area
Urbanization of Member Lands SRP expects to be “fully urbanized” by 2017
P G S PHX T M G C
[demand: 300 – 340 kaf] Primary water sources for Valley cities: SRP (surface and ground) CAP (surface) City wells (ground) http://phoenix.gov/waterservices/wrc/yourwater/wrplan.html
100 90 80 70 60 50 40 30 20 10 0 1890 1900 1910 1920 1930 1940 1950 1960 1970 1980 1990 2000 2010 Salt River Project Historic Drought Periods (Average Runoff 1913–2010 = 1,198,536 AF) Longer Period Of Sustained Drought 7 Years1942 - 194862% “Drought of Record” 4 Years1974 - 197752% 19+Years1995 – 2014???% 5 Years1953 - 195747% % Average 7 Years1898 - 190435% Year
www.srpnet.com Jon.Skindlov@srpnet.com Questions?
http://phoenix.gov/waterservices/wrc/yourwater/wrplan.html http://phoenix.gov/webcms/groups/internet/@inter/@dept/@wsd/documents/web_content/wsdfaqsupply030714.pdf
Upper Colorado River Basin Salt-Verde-Tonto River Basin
Demand • Demand is the water that is called for at a predetermined time to be delivered to shareholder or contract customer land, water treatment plants, or power plants. • Today, demand is difficult to predict: • Water use efficiency • Increasing densification • Extended drought • Agriculture to urban • Economic downturn • From 2001-2010 total demand ranged from 785 KAF to 910 KAF.
Demand • Demand is difficult to predict: • Water use efficiency • Increasing densification • Extended drought • Agriculture to urban • Economic downturn