Download
1 / 7
80 likes | 141 Vues
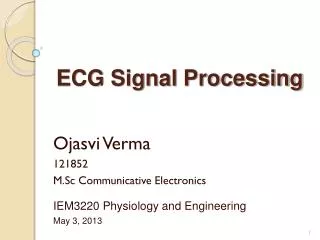
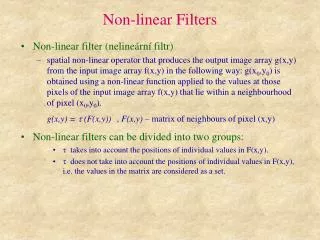
Electrocardiogram ECG signal is the electrical recording of heart activity. The Electrocardiogram ECG reflects the activities and the attributes of the human heart and reveals very important hidden information. The information is extracted by means of ECG signal analysis to gain insights that are very crucial in explaining and identifying various pathological conditions, but the ECG signal can be distorted with noise. Noise can be any interference due to motion artifacts or due to power equipment that are present where ECG had been taken. A typical computer based ECG analysis system includes a signal pre processing, beats detection and feature extraction stages, followed by classification. Automatic identification of arrhythmias from the ECG is one important biomedical application of pattern recognition. Moreover ECG signal processing has become a prevalent and effective tool for research and clinical practices. The motion artifacts are effectively removed from the ECG signal which is shown by beat detection on noisy and cleaned ECG signals after LMS and NLMS processing. This paper focuses on ECG signal processing using Least Mean Square LMS and Normalized Least Mean Square NLMS , which has received increasing attention as a signal conditioning and feature extraction technique for biomedical application. Ms. Chhavi Saxena | Dr. P.D Murarka | Dr. Hemant Gupta "ECG Signals Processing using Adaptive Linear Filters" Published in International Journal of Trend in Scientific Research and Development (ijtsrd), ISSN: 2456-6470, Volume-1 | Issue-5 , August 2017, URL: https://www.ijtsrd.com/papers/ijtsrd2342.pdf Paper URL: http://www.ijtsrd.com/computer-science/data-processing/2342/ecg-signals-processing-using-adaptive-linear-filters/ms-chhavi-saxena<br>

E N D
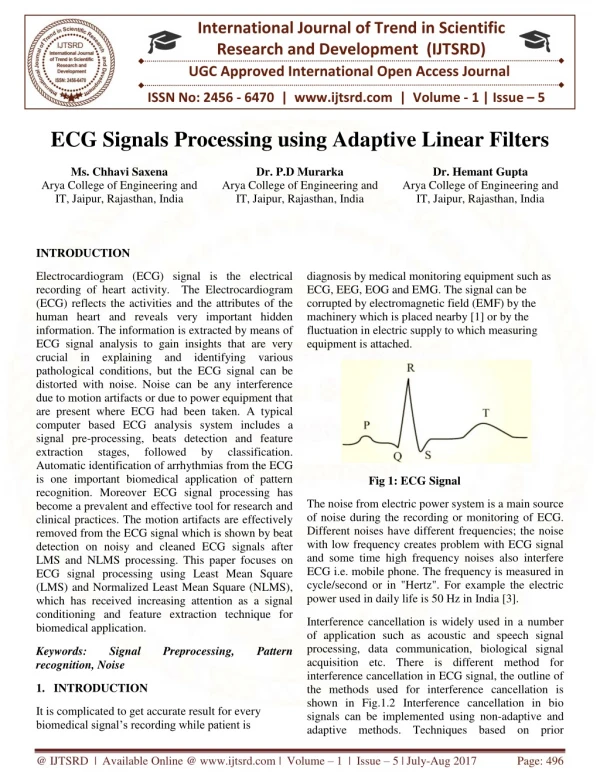
International Journal of Trend in Scientific Research and Development (IJTSRD) UGC Approved International Open Access Journal ISSN No: 2456 - 6470 | www.ijtsrd.com | Volume - 1 | Issue – 5 ECG Signals Processing using Adaptive Linear Filters Ms. Chhavi Saxena Arya College of Engineering and IT, Jaipur, Rajasthan, India IT, Jaipur, Rajasthan, India Dr. P.D Murarka Arya College of Engineering and Dr. Hemant Gupta Arya College of Engineering and IT, Jaipur, Rajasthan, India INTRODUCTION Electrocardiogram (ECG) signal is the electrical recording of heart activity. The Electrocardiogram (ECG) reflects the activities and the attributes of the human heart and reveals very important hidden information. The information is extracted by means of ECG signal analysis to gain insights that are very crucial in explaining and identifying various pathological conditions, but the ECG signal can be distorted with noise. Noise can be any interference due to motion artifacts or due to power equipment that are present where ECG had been taken. A typical computer based ECG analysis system includes a signal pre-processing, beats detection and feature extraction stages, followed Automatic identification of arrhythmias from the ECG is one important biomedical application of pattern recognition. Moreover ECG signal processing has become a prevalent and effective tool for research and clinical practices. The motion artifacts are effectively removed from the ECG signal which is shown by beat detection on noisy and cleaned ECG signals after LMS and NLMS processing. This paper focuses on ECG signal processing using Least Mean Square (LMS) and Normalized Least Mean Square (NLMS), which has received increasing attention as a signal conditioning and feature extraction technique for biomedical application. diagnosis by medical monitoring equipment such as ECG, EEG, EOG and EMG. The signal can be corrupted by electromagnetic field (EMF) by the machinery which is placed nearby [1] or by the fluctuation in electric supply to which measuring equipment is attached. by classification. Fig 1: ECG Signal The noise from electric power system is a main source of noise during the recording or monitoring of ECG. Different noises have different frequencies; the noise with low frequency creates problem with ECG signal and some time high frequency noises also interfere ECG i.e. mobile phone. The frequency is measured in cycle/second or in "Hertz". For example the electric power used in daily life is 50 Hz in India [3]. Interference cancellation is widely used in a number of application such as acoustic and speech signal processing, data communication, biological signal acquisition etc. There is different method for interference cancellation in ECG signal, the outline of the methods used for interference cancellation is shown in Fig.1.2 Interference cancellation in bio signals can be implemented using non-adaptive and adaptive methods. Techniques based on prior Keywords: recognition, Noise Signal Preprocessing, Pattern 1.INTRODUCTION It is complicated to get accurate result for every biomedical signal’s recording while patient is @ IJTSRD | Available Online @ www.ijtsrd.com | Volume – 1 | Issue – 5 | July-Aug 2017 Page: 496
International Journal of Trend in Scientific Research and Development (IJTSRD) ISSN: 2456-6470 knowledge of the signal and the noise characteristics such as averaging, correlation etc have been widely used for interference cancellation in bio signals. But the drawback of non-adaptive techniques is that they are time invariant in nature. The above mentioned problem has been overcome by the adaptive methods [6]. sample values of the tap input vector and an error signal. The algorithm iterates over each tap weight in the filter, moving it in the direction of the approximated gradient. The idea behind LMS filters is to use the method of steepest descent to find a coefficient vector n w which minimizes a cost function [4][6]. In practical application of adaptive filtering, a fixed step size Algorithm is required for INTERFERENCE CANCELATION METHOD (i)Easier implementation (ii)Single adjustable parameters µ for controlling the convergence rate but slow convergence Non- Adaptive Adaptive Normalized LMS (NLMS) Algorithm-Normalized Least Mean Square (NLMS) is actually derived from Least Mean Square (LMS) algorithm. The need to derive this NLMS algorithm is that the input signal power changes in time and due to this change the step-size between two adjacent coefficients of the filter will also change and also affect the convergence rate. Due to small signals this convergence rate will slow down and due to loud signals this convergence Linear Filter Non Linear Filter LMS KALMAN RSS interference rate will increase and give an error. So to overcome this problem, try to adjust the step-size parameter with respect to the input signal power. Therefore the step- size parameter is said to be normalized. When design the LMS adaptive filter, one difficulty we meet is the selection of the step-size parameter μ. The main drawback of the pure LMS algorithm is that it is sensitive to the scaling of its input u (n). This makes it very hard to choose a learning rate μ that guarantees stability of the algorithm [7]. Fig.1.2 Cancellation Different Methods of Adaptive Filter An adaptive filter is a filter that self-adjusts its transfer function according to an optimization algorithm driven by an error signal. Because of the complexity of the optimization algorithms, most adaptive filters are digital filter. When the convergence factor μ is large, the algorithm experiences a gradient noise amplification problem. In order to solve this difficulty, we can use the NLMS (Normalized Least Mean Square) algorithm. Normalization algorithm results in smaller step size values than the conventional LMS algorithm. The normalized algorithm usually converges faster than the LMS algorithm, since it utilizes a variable convergence factor aiming at the minimization of the instantaneous output error. Fig.1.3 Block diagram of an adaptive filter Comparison between LMS & NLMS-ECG signals which are generated contain noise signal. To reduce these noise signals LMS algorithm and NLMS algorithm are used. Here two algorithms are studied and output results for noise cancelling are shown in Least Mean Square (LMS) Algorithm-The LMS is an approximation of the steepest descent algorithm, which uses an instantaneous estimate of the gradient vector. The estimate of the gradient is based on @ IJTSRD | Available Online @ www.ijtsrd.com | Volume – 1 | Issue – 5 | July-Aug 2017 Page: 497
International Journal of Trend in Scientific Research and Development (IJTSRD) ISSN: 2456-6470 Fig. 1.4 & Table 1.1 It is clear that these algorithms remove the noise efficiently present in the ECG signal and the performance of NLMS is better than LMS. Above mentioned proposed work is implemented using MATLAB (short for MATrix LABoratory) as it is commercial software product, which is available from the Math works. This programming language is very powerful allows matrix manipulation, plotting of functions and data, implementation of algorithms, creation of user interfaces, and interfacing with other programming languages (C, C++, FORTRAN and Java). One of the most beneficial features is graphical visualization which helps us have confidence in results by monitoring and analyzing resultant plots. MATLAB has some advantages compared with conventional computer languages for technical problem solving. Among them are following [2]. (a) (1)Ease of use. (2)Platform independence. (3)Predefined functions. (4)Device-independent plotting. (5)Graphical user interface. 2. METHODOLOGY -In this paper, two new algorithms are proposed, developed and validated, one for removing non-trivial noises in ECGs using the LMS and the other deploys the NLMS extracted features to improve recognition of arrhythmias. Firstly, independent component analysis has been studied and found effective to separate out motion induced artifacts in ECG. The second algorithm has been developed for ECG feature extraction, in which the independent component analysis has been used to obtain a set of features, or basis functions of the ECG signals generated hypothetically. The selection of the appropriate feature set for classifier has been found important for better performance and quicker response. (b) and (c) respectively Fig.1.4 (a) ECG signal (b) LMS algorithm (c) Implementations of LMS Algorithm: Initialization: If prior knowledge of the tap weight vector w (n) is available, use it to select an appropriate value for w (n),otherwise, set w(0)=0. Take,0<u<(1/M, Smax) Where: Smax=the maximum value of PSD of the tap input u(n) NLMS algorithm Table 1.1 Summary of ECG noise cancellation S. No. Algorithm Percentage of noise cancellation 48.34% 59.54% 1 2 NLMS LMS @ IJTSRD | Available Online @ www.ijtsrd.com | Volume – 1 | Issue – 5 | July-Aug 2017 Page: 498
International Journal of Trend in Scientific Research and Development (IJTSRD) ISSN: 2456-6470 Data: Give u (n) = M by 1 tap input vector at time n, Implementations of NLMS Algorithm In standard form of least mean square (LMS) filter in adjustment applied to the tap weight vector of the filter at iteration n consist of product of three terms: d (n) = desired response at time n (i) The step size parameter µ, which is under the designer’s control. The tap input vector u(n),which is supplied by a source of information. The estimation error e(n),which is calculated at iteration n. To be computed: w (n) = estimate of tap-weight vector at time n (ii) Computation: y (n) = w (n).u(n) e(n) = d(n) - y(n) (iii) w (n+1) = w (n) +µ.e (n).u (n) The adjustment is directly proportional to the tap input vector u(n). Therefore, when u(n) is large, the LMS filter suffer from gradient noise amplification problem. Also, the maximum step size u guarantee stability signal, u (n). One important technique for optimizing speed of convergence while maintaining the adjustment applied to tap weight vector at iteration n+1 is ‘normalized’ with respect to the squared Euclidean norm of the tap –input vector u(n) at iteration n –hence the term “normalized”. It can be briefly described as follows: Table 1.2 Variables use in LMS algorithm Variable Description N The current time index u(n) The vector of buffer input sample at step n=[u(n).u(n-1)…u(n-M-1)]T u*(n) Complex conjugate of the vector of buffered input sample at step n w(n) The vector of filter weight estimates at step n. y(n) The filtered out put at step n. e(n) The error signal at step n. d(n) The desired input signal at step n. M The filter length. µ The adaption step size. Table 1.3 Least Mean Square (LMS) algorithm S. No. 1 Initial Conditions : Length filter=L Input u[0,0,0…0]T Wight w[0,0,0…0]T For each instant of time, n = 1, 2,…, compute: 2 Output signal: y(n) = wT . u(n); 3 Estimation Error: e(n) = d(n)-y(n); 4 Tap-Weight Adaptation: .e(n).u(n); Initialization: If prior knowledge of the tap weight vector w(n) is available, use it to select an appropriate value for w(0), otherwise set w(0)=0. Take, 0< <2(E[ǀ u (n) ǀ2 ]D (n)/E [ ǀ e (n) ǀ2]); where , E[ǀ u (n) ǀ2 ] = input signal power , E [ ǀ e (n) ǀ2] = error signal power , D (n) mean square deviation of weight vector. Data: Given u (n) =M by 1 tap input vector at time n. d (n) = desired response at time n. To be computed w(n) = estimate of tap- weight vector at time n. Computation: y (n) = w (n)T. u (n) e(n) = d(n) - y(n) w (n+1) = w (n) +µ.e (n).u (n) Thealgorithm required 2*M+1 addition and 2*M+1 multiplication at any iteration n where M is the tap length or filter order. The computation complexity depends on the order of the filter and it must be carefully chosen. The following figure shown the flow chart to implement the algorithm LMS algorithm 0< µ < 1 of Adaptive vector: vector: = 1, 2, 3…, compute: w (n+1) = w + 2 µ @ IJTSRD | Available Online @ www.ijtsrd.com | Volume – 1 | Issue – 5 | July-Aug 2017 Page: 499
International Journal of Trend in Scientific Research and Development (IJTSRD) ISSN: 2456-6470 Table 1.4 Variables used in NLMS algorithm parameters such as step size, filter length and number of iterations. All Simulations presented are different parameter such as step size, filter tap, iterations. Variable Description N u(n) The current time index The vector of buffer input sample at step n=[u(n).u(n-1)…u(n-M-1)]T Complex conjugate of the vector of buffered input sample at step n The vector of filter weight estimates at step n The filtered out put at step n The error signal at step n The desired input signal at step n The filter length The adaption step size Small constant NLMS adaption constant 3.1 Results for LMS algorithm: In this case µ =0.05, Filter length is 15 and 25 and 1400 iterations Fig. 1.5,1.6 given below. u*(n) Input ECG Signal w(n) 1 0 y(n) e(n) d(n) M µ C Α Table 1.5 Normalized Least Mean Square (NLMS) algorithm S.NO NLMS ALGORITHM 1 Initial Conditions: -1 0 200 400 600 800 1000 1200 1400 ECG signal+50 Hz noise 2 0 -2 0 200 400 600 800 1000 1200 1400 Recover using LMS Filterd Output 2 0 -2 0 200 400 600 800 1000 1200 1400 Figure: 1.5 LMS algorithm where µ=0.05, Filter length = 15 0< α < 2 and c is small constant. Length of Adaptive Filter=L Input u[0,0,0…0]T Weight vector[0,0,0..0]T Input ECG Signal 1 0 vector: -1 0 200 400 600 800 1000 1200 1400 ECG signal+50 Hz noise 2 0 For each instant of Time,n=1,2,…,compute: Length of Adaptive filter=L -2 0 200 400 600 800 1000 1200 1400 Recover using LMS Filterd Output 2 y(n) = wT . u(n); 2 Output signal: Estimation Error: adaption step size: 0 -2 0 200 400 600 800 1000 1200 1400 3 e(n) = d(n)-y(n); Fig.1.6 LMS algorithm where µ=0.05, Filter length = 25 4 w(n)+[2 α/c+u(n)T.u(n)]e(n)u(n) w (n+1) = w + 2 µ .e(n).u(n); LMS algorithm: In this case µ =0.09, Filter length is 15, 20 and 35 and 1400 iterations Fig. 1.7,1.8, 1.9 given below. 3. RESULTS This paper presents the results of simulation using MATLAB to investigate the performance behaviors of various adaptive filter algorithms in non stationary environment with different step sizes. The principle means of comparison is the error cancellation capability of the algorithms which depends on the @ IJTSRD | Available Online @ www.ijtsrd.com | Volume – 1 | Issue – 5 | July-Aug 2017 Page: 500
International Journal of Trend in Scientific Research and Development (IJTSRD) ISSN: 2456-6470 3.2 Results for NLMS algorithm: Input ECG Signal 1 In this case c = 0.019, α = 0.102, Filter length is 15, 20, 30 and 1400 iterations Fig.1.10, 1.11, 1.12 shown in given below. 0 -1 0 200 400 600 800 1000 1200 1400 ECG signal+50 Hz noise 2 Input ECG Signal 1 0 0 -2 -1 0 200 400 600 800 1000 1200 1400 0 200 400 600 800 1000 1200 1400 ECG signal+50 Hz Noise Recover using LMS Filterd Output 2 2 0 0 -2 0 200 400 600 800 1000 1200 1400 Recover NLMS Filtered Output 2 -2 0 200 400 600 800 1000 1200 1400 0 -2 0 200 400 600 800 1000 1200 1400 Fig.1.7 LMS algorithm where µ=0.09, Filter length = 15 Fig.1.10 NLMS algorithm where c=0.019, α=0.102, Filter length = 15 Input ECG Signal 1 Input ECG Signal 0 1 -1 0 0 200 400 600 800 1000 1200 1400 ECG signal+50 Hz noise -1 2 0 200 400 600 800 1000 1200 1400 ECG signal+50 Hz Noise 2 0 0 -2 0 200 400 600 800 1000 1200 1400 -2 0 200 400 600 800 1000 1200 1400 Recover using LMS Filterd Output Recover NLMS Filtered Output 2 2 0 0 -2 0 200 400 600 800 1000 1200 1400 -2 0 200 400 600 800 1000 1200 1400 Fig.1.11 NLMS algorithm where c=0.019, α=0.102, Filter length = 20 Fig.1.8 LMS algorithm where µ=0.09, Filter length = 20 Input ECG Signal 1 Input ECG Signal 1 0 -1 0 200 400 600 800 1000 1200 1400 0 ECG signal+50 Hz Noise 2 -1 0 0 200 400 600 800 1000 1200 1400 ECG signal+50 Hz noise -2 2 0 200 400 600 800 1000 1200 1400 Recover NLMS Filtered Output 2 0 0 -2 -2 0 200 400 600 800 1000 1200 1400 0 200 400 600 800 1000 1200 1400 Recover using LMS Filterd Output 2 Fig.1.12 NLMS algorithm where c=0.019, α=0.102, Filter length = 30 0 -2 NLMS algorithm: 0 200 400 600 800 1000 1200 1400 In this case c= 0.019, α=0.102, Filter length is 40 and 1400 iterations in fig 1.13 Fig.1.9 LMS algorithm where µ=0.09, Filter length = 35 @ IJTSRD | Available Online @ www.ijtsrd.com | Volume – 1 | Issue – 5 | July-Aug 2017 Page: 501
International Journal of Trend in Scientific Research and Development (IJTSRD) ISSN: 2456-6470 Adaptive Noise Cancellation can be compared. Other algorithms that can be used include Recursive Least Squares. Moreover, this project does not consider the real time processing of finite-length filters and the causal approximation and also improvement of the thesis can be further implemented with different algorithms such as RLS algorithm and wiener filter to achieve the desired results. Input ECG Signal 1 0 -1 0 200 400 600 800 1000 1200 1400 ECG signal+50 Hz Noise 2 0 -2 0 200 400 600 800 1000 1200 1400 Recover NLMS Filtered Output 2 REFERENCES 0 1)R.S Khandpur “Biomedical instrumentation hand book), 11th reprint 2008 Tata McGraw – Hill publication company Limited New Delhi. ISBN-13: 978-0-07-0473355-3. -2 0 200 400 600 800 1000 1200 1400 Fig.1.13 NLMS algorithm where c=0.019, α=0.102, Filter length. = 40 2)Stephen J. chapman “MATLAB programming for engineers” 3rd Reprint Edition 2003 by Thomson asia Pte Ltd., Singapore ISBN: 981- 240-606-9. 4. CONCLUSION The objective was to optimize different adaptive filter algorithms so that we can reduce interference. In this paper, different Adaptive algorithms were analyzed and compared. 3)Malindi, P.(2002) “Cancelling power line interference in electrophysiological signals”. ECT Research Journal, 2. The parameter, LMS step size µ play important role in determine the convergence speed and stability. Convergence speed can be controlled by parameter step size µ. I have plot LMS response for step size µ=0.05 and µ=0.09 with different filter length 15, 20, 25, 30. I observed that with increased filter order, accuracy increased and with increased step size convergence rate took place fast. 4)Widrow B. and Hoff M.E. (1960), “Adaptive switching circuits”, Convention Record, pp. 96-104, New York. 5)Zhang Jiashu, Tai Heng-Ming, “Adaptive Noise Cancellation Algorithm for Speech Processing”, IEEE Transactions, pp 2489- 2492, 2007. 6)Jigram H. Shah, Jay M. Joshi, “Digital signal processing” University science press laxmi publication company Limited New Delhi. 7)Suzanna M. M. Martens , Massimo Mischi, S. Guid Oei, ‘An Improved Adaptive Power Line Interference Electrocardiography’ IEEE transactions on biomedical engineering, vol. 53, no. 11, November 2006. 8)Syed Zahurul Islam, Syed Zahidul Islam, Razali Jidin, Mohd. Alauddin Mohd. Ali, “Performance Study of Adaptive Filtering Algorithms for Noise Cancellation of ECG Signal”, IEEE 2009. In IREWESCON These results shows that the LMS algorithm has slow convergence but simple to implement and gives good results if step size is chosen correctly and is suitable for stationary environment. The merits of LMS algorithm is less consumption of memory and amount of calculation. The NLMS algorithm changes the step- size according to the energy of input signals hence it is suitable for both stationary as well as non-stationary environment. The implementation of algorithms was successfully achieved for c = 0.019, α = 0.102, filter length is 15, 20, 30, 40 and 1400 iterations. Canceller for The noise cancellation performance of NLMS was observed consistently better when compared with LMS algorithm. 5. SCOPE In this work, only the Least-Mean-Squares (LMS) and Normalized Least-Mean-Squares (NLMS) Algorithm has been used. Other adaptive algorithms can be studied and their suitability for application to @ IJTSRD | Available Online @ www.ijtsrd.com | Volume – 1 | Issue – 5 | July-Aug 2017 Page: 502