Download

1 / 8
80 likes | 268 Vues
Clock propagation measurements & Impedance simulations. Rhorry Gauld , PLUME Meeting – 3 rd May 2011. Clock Propagation. Input signal ranging from 80MHz – 240MHz Absolute peak-peak measurements taken at; [1] – 100 Ohm `Termination’ [2] – `Ears’ [3] – Break out card(BOC)

E N D
Clock propagation measurements & Impedance simulations RhorryGauld, PLUME Meeting – 3rd May 2011 Rhorry Gauld, PLUME Meeting – 3rd May 2011
Rhorry Gauld, PLUME Meeting – 3rd May 2011 Clock Propagation • Input signal ranging from 80MHz – 240MHz • Absolute peak-peak measurements taken at;[1] – 100 Ohm `Termination’[2] – `Ears’[3] – Break out card(BOC) • 1GHz Oscilloscope + 1.5GHz Differential Probe used
Rhorry Gauld, PLUME Meeting – 3rd May 2011 Results – Graphic’10 vs. Optiprint’10 • Comparable rise times for both flexes • Slower rise time at termination as expected – due to degradation of signal along clock path
Rhorry Gauld, PLUME Meeting – 3rd May 2011 Scope images – 140MHz Graphic Flex – Ear Rise = 460 ps Graphic Flex – Termination Rise = 540 ps Optiprint Flex – Termination Rise = 540 ps Optiprint Flex – Ear Rise = 480 ps
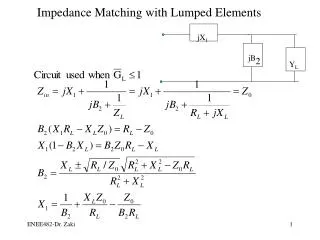
Rhorry Gauld, PLUME Meeting – 3rd May 2011 Impedance Simulations • Simulations done using: Polar Instruments SI9000 v7.1.0 1b – simulating impedance with a ground plate 2b – simulating impedance with no ground plate or plate not at ground by increasing the Distance H1 to maximum and using a dielectric constant of 1 (Er1)
Rhorry Gauld, PLUME Meeting – 3rd May 2011 Assumptions Trace ThicknessGraphic'10 17 micronsOptiprint'10 20 micronsOptiprint'11 13 microns Height between trace and ground Graphic'10 50 micronsOptiprint'10 25 micronsOptiprint'10 12 microns Polyimide Dielectric 3.4Trace Width 60 micronsTrace Seperation 75 micronsCoating ~25 microns? Graphic ‘10 – with ground plate
Rhorry Gauld, PLUME Meeting – 3rd May 2011 Results Removing the ground plate increases the differential impedance Both the change in trace thickness and in substrate height between Optiprint versions ~equally contribute to change in impedance of ’10-’11
Rhorry Gauld, PLUME Meeting – 3rd May 2011 Is this acceptable? As a rough estimate this seems okay Since the majority of the clock path is ground this should bring us down to the 100 Ohm value we need


![G5 - ELECTRICAL PRINCIPLES [3 exam questions - 3 groups]](https://cdn0.slideserve.com/382273/g5-electrical-principles-3-exam-questions-3-groups-dt.jpg)