Download
1 / 22
220 likes | 465 Vues
Comparing Time Series, Neural Nets and Probability Models for New Product Trial Forecasting. Eugene Brusilovskiy Ka Lok Lee These slides are based on the authors’ presentation at the 4 th Annual Hawaii International Conference on Statistics, Mathematics, and Related Fields.

E N D
Comparing Time Series, Neural Nets and Probability Models for New Product Trial Forecasting • Eugene Brusilovskiy • Ka Lok Lee • These slides are based on the authors’ presentation at the 4th Annual Hawaii International Conference on Statistics, Mathematics, and Related Fields
Problem Introduction • Goal: To predict future sales using sales information from an introductory period • Product: A new (unnamed) soft beverage that was introduced to a test market • Data: We have 52 weeks of sales data, which we split into training (first 39 weeks) and validation (last 13 weeks) datasets • We build the models using the training dataset and then examine how well the models predict sales in the last 13 weeks • The methods employed here apply to predicting the sales of any newly introduced consumer good
Prediction Methods Used • Time Series • Most common technique, available in almost every statistics software • Neural Nets • Extensive data-mining tool (requires expensive software) • Probability Modeling • Not always available in standard statistical packages, may be coded in Excel 3
Training Data – Cumulative Sales for the First 39 Weeks T = 39 4
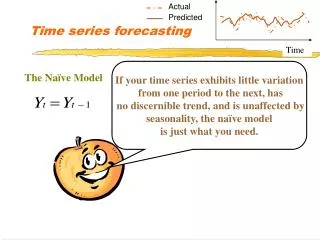
Time Series • A time-series (TS) model accounts for patterns in the past movements of a variable and uses that information to predict its future movements. In a sense a time-series model is just a sophisticated method of extrapolation (Pindyck and Rubinfeld, 1998). 5
Time Series • Autoregressive Moving Average Model: ARMA(1,1) – generally recognized to be a good approximation for many observed time series or 6
Neural Networks • A Neural Network(NN) is an information processing paradigm inspired by the way the brain processes information (Stergiou and Siganos, 1996). • MLP (The Multi-Layer Perceptron) is used here 7
Neural Networks • A Neural Network consists of neuron layers of 3 types: • Input layer • Hidden layer • Output layer • We use two models with different MLP architectures: a model with one hidden layer and a model with a skip layer 8
Neural Networks (cont’d) Given the rule on the left, we deduce the pattern on the right: AND 9
Neural Networks Structure of Neural Net Models: 10
Neural Networks • Neural Networks are especially useful for problems where • Prediction is more important than explanation • There are lots of training data • No mathematical formula that relates inputs to outputs is known • Source: SAS Enterprise Miner Reference Help. Neural Network Node: Reference 11
Probability Modeling • Probability models: • Are representations of individual buying behavior • Provide structural insight into the ways in which consumers make purchase decisions (Massy el at.,1970) • Specific assumptionsof purchase process and latent propensity (Bayesian flavor) • Explicit consideration of unobserved heterogeneity 12
Probability Modeling • Individual purchase time or time-to-trial is modeled by “Diffusion Model”. • Exponential-Gamma (EG), also known as the Pareto distribution (Hardie et al., 2003) • Time to trial ~ Exponential (λ) • λ~ Gamma (r, α) 13
Probability Modeling • After solving the integral, the cumulative probability function becomes: • F(t) = • LL = • Estimation uses Excel Solver 14
Results • All three models do a relatively good job predicting future sales, but Exponential Gamma is the best Where T is the total number of time periods (weeks). Here, t=1 is the first validation week (week 40) 16
New Product Sales – Results T=39 17
Time Series - Results • Captures “jumps” in the training data • Implies no additional sales (the product is “dead”), extreme case of forecast 18
Neural Nets - Results • Can sometimes be over-responsive to “jumps” in training data 19
Probability Model - Results • Overall, the best method • Furthermore, allows the analyst to make statements about the consumers in the market 20
Next Steps • Include covariates • Different training periods • Perform comparative analysis for other areas of forecasting • Customer Lifetime Value 21
References • Hardie B. G.S., Zeithammer R., and Fader P. (2003), Forecasting New Product Trial in a Controlled Test Market Environment, Journal of Forecasting, 22: 391-410 • Massy, W.F., Montgomery, D.B. and Morrison, D.G. (1970), Stochastic Models of Buying Behavior, The M.I.T. Press, 464 pp. • Pindyck, R.S. and Rubinfeld D.L. (1998), Econometric Models and Economic Forecasts, Irwin/McGraw-Hill. • SAS Enterprise Miner Reference Help. Article: Neural Network Node: Reference • Stergiou, C., & Siganos, D. (1996), Introduction to Neural Networks. Available online at www.doc.ic.ac.uk/~nd/surprise_96/journal/vol4/cs11/report.html 22