Download
1 / 31
320 likes | 511 Vues
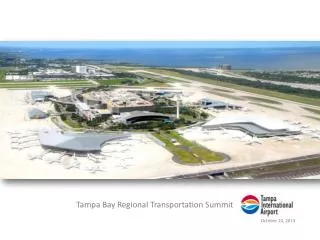
Portland Transportation Safety Summit. October 6, 2008. Today’s Agenda State of Transportation Safety. Safety Benchmarks Safety Accomplishments Understanding the impact of $4 gas and a weak economy on transportation trends Building a stronger partnership with the health community

E N D
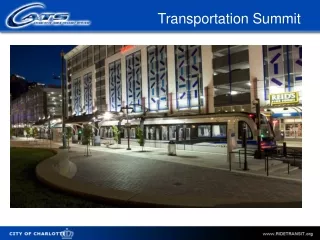
Portland TransportationSafety Summit October 6, 2008
Today’s AgendaState of Transportation Safety • Safety Benchmarks • Safety Accomplishments • Understanding the impact of $4 gas and a weak economy on transportation trends • Building a stronger partnership with the health community • Updates on projects and services
BENCHMARKS Portland Motor Vehicle Fatalities and Injuries • 1996: 41 people died in motor vehicles • 2007:18 people died in motor vehicles • Fatalities about even for motor vehicles • 15 motor vehicle fatalities (year to date in 2007) • 14 motor vehicle fatalities (year to date in 2008) • Speeding and DUII are leading causes • 4 of 12 to date fatalities were motorcycle riders
BENCHMARKS Speeding and DUII Continue to be Major Factor in Motor Vehicle Fatalities • In 2007: • 40% of all fatalities involved alcohol or drugs • 56% of all fatalities involved speeding • DUII and speed linked to growth in motorcycle fatalities - 66% of motorcycle fatalities include speed, alcohol, or drugs
BENCHMARKS Portland Pedestrian Fatalities and Injuries • Our collective efforts appear to be making Portland streets safer for pedestrians • Fatalities down in 2008 • 7 pedestrian fatalities (year to date in 2007) • 2 pedestrian fatalities (year to date in 2008) • Most in 1996: 17 pedestrian fatalities • Least in 2006: 6 pedestrian fatalities
BENCHMARKS Emerging Concerns • Motorcycle and scooter safety • Faster, more powerful vehicles • Lots of new riders • Bicycle versus pedestrian crashes • More users in confined spaces • Need for more safety improvements • Need for more education • Seeing Eye to Eye
BENCHMARKS Improvements Needed on High Speed Multilane Arterials • Fatalities and serious pedestrian injuries are clustered on high speed, high volume arterials • Most pedestrian crashes • West Burnside • 82nd Avenue • 122nd Avenue • Foster Road Speed Dramatically Increases Pedestrian Fatality Rate 90% Fatality Rate 40% Fatality Rate 5% 20 MPH 30 MPH 40 MPH
BENCHMARKS Improvements Needed in East Portland • Over the last decade, 82nd Avenue of Roses has averaged 1 pedestrian fatality per year • Last year, 2 pedestrians died crossing 122nd Avenue • East Portland has had 30+% of Portland’s residential development in the past decade • High, and increasing, use of transit and walking SE Division Street @ SE 142nd Avenue
BENCHMARKS Improvements Ongoing in East Portland • 82nd Avenue of the Roses Safety Corridor Project is creating a comprehensive safety plan – excellent PDOT, ODOT, TriMet and community partnership • 73% of one-time funds for pedestrian safety spent in East Portland • 102nd Avenue Improvement Project widens sidewalks and improves pedestrian crossings NE 102nd & Wygant SE Division Street @ SE 142nd Avenue
BENCHMARKS Portland Bicycle Fatalities and Injuries • 2007 had most bicycle fatalities on record: 6 • Fatalities down in 2008 • 3 bicycle fatalities (year to date in 2007) • 0 bicycle fatalities (year to date in 2008) • Fatalities 25-year average: 2 • Per trip crash rate down 70% over past decade
BENCHMARKS Low-cost Engineering Improvements Can Save Lives • 19-year-old Tracey Sparling was killed in right hook crash at 14th & Burnside, 10/07 • Bike box places cyclists in front so drivers can better see them • $4,000 improvement
BENCHMARKS Additional Bike Safety Highlights Since 2007 • Education • Eye to Eye • Truck and bike safety events • See and Be Seen • Engineering • Striping improvements • SE 162nd from Powell to Stark • New bike lane connection on SW 30th at Barbur • Rose Quarter Transit Center (operational within a month) • Traffic calming • Green Streets (example: Clay Street Green Street Project) • Traffic slowing median island at Rosa Parks and Willamette • Closing right turn at Interstate and Greeley • Signals • New bike signal at 22nd & Sandy • HAWK Signals at 41st/Burnside & 18th/Sandy • Enforcement • Community Policing Agreement
BENCHMARKS How Do We Compare? TRAFFIC FATALITIES PER 100,000 RESIDENTS 1996 and 2006 • [Portland vs. Other Cities]
BENCHMARKS How Do We Compare? TRAFFIC FATALITIES PER 100,000 RESIDENTS 1996 and 2006
BENCHMARKS Safety Concerns Limiting Options • Significant number of Portlanders limit walking, biking and/or taking transit due to transportation safety concerns • Efforts are underway to get better data on this benchmark – recent results show improved confidence • Addressing this issue is a core component of the Portland Plan
BENCHMARKS National Perspective • If the US had kept pace with safety trends in most other industrialized countries, 20,000 fewer people would die in traffic crashes each year! • Comprehensive approach: engineering, education, and enforcement Source: The Dramatic Failure of US Traffic Safety Policy, Leonard Evans
BENCHMARKS Transit Ridership Increasing • Portland transit ridership up 46% in last decade • Portland: 81 transit trips per person per year • Seattle: 66 • Minneapolis: 43 • Sacramento: 29
BENCHMARKS Bicycle Ridership Increasing • 17,000 bicycle trips each day across 4 bridges in 2008 (Hawthorne, Steel, Broadway, Burnside) • 1 in 9 vehicles on these bridges is a bicycle • Big increases in neighborhoods throughout city – especially North and inner-Southeast • Ridership has tripled in last decade • 16% increase over past year
ACCOMPLISHMENTS Reducing Driver Error Improvements (FY 2007- 08) • Speeding • 125 new speed bumps • 15 new speed reader boards • Red Light Running • 5 new red light cameras • High Crash Intersections • Improvements at 12 high crash intersections • DUII • Completed DUII Strategy / Enhanced Enforcement • Youth Driver • 2008: 74 graduated license classes serving 2347 youth and parents • Child Safety Seats • 2008: 9 events hosted and 675 seats checked • Motorcycle Safety • Formation of Advisory Committee • School Safety • 4 new sets of flashing beacons
ACCOMPLISHMENTS Pedestrian/Bicycle Safety Improvements (FY 2007-2008) • Crossing Improvements • 18 new pedestrian islands • Installation of crosswalks in six business districts • High Crash Intersections Bikes • 13 new green bicycle boxes • High Crash Intersections • Pedestrian/bicycle improvements included in intersection safety projects • DUII • Completed DUII Strategy
ACCOMPLISHMENTS Safety Education • Eye-to-Eye Campaign • Share the Road Safety Class • I Brake For People • See & Be Seen • Bike Box Campaign • Yard Sign Program • I Share The Road Pledge Program • Share The Path • Bike Light Distribution • PGE Truck Safety
ACCOMPLISHMENTS Safe Routes to School Improvements (FY 2007- 08) • Comprehensive Safe Routes Services • 25 schools • Safety improvements • Over 30 projects including pedestrian islands, crosswalks, missing sidewalks, and traffic calming • Enforcement • Comprehensive enforcement during first two weeks of school • Daily strategic enforcement in school zones throughout school year
ACCOMPLISHMENTS Corridor Projects (FY 2007- 08) • 82nd Avenue of Roses High Crash Corridor • Engineering: pedestrian median islands, curb ramps, sidewalk infill, signal optimization • Enforcement: speeding, DUII, aggressive driving • Education: multi-modal safety outreach, Senior Walking Challenge, Portland Walks -- Be Safe trainings, SAFE TRIPS newsletter
Planning for Corridor Safety Projects Division, Burnside, and Russell Update of Bicycle Master Plan Focus on safety and developing bicycle boulevards ACCOMPLISHMENTS Corridor Projects (FY 2007- 08) • Accomplishments on Corridor Safety • Sandy • Powell • Vancouver/Williams • Fremont • Killingsworth • Denver • Foster
TRENDS Portland Transportation Safety Summit PANEL OVERVIEW
TRENDS $4 Gas and Weakening Economy • Pre-$4 gas: • Average household - transportation third highest household cost behind housing and food • Low income household – transportation second highest expense after housing • 20 cents of every dollar earned by the average household and 40 cents of every dollar earned by the poor spent on transportation • AAA estimates annual cost of owning a car $12,000+/year • More Portlanders walking, biking, and taking transit to reduce costs
TRENDS First Panel: Economy Changes • Jennifer Dill, PhD, PSU • Lavinia Gordon, PDOT • Pam Peck, Metro • Steve Callas, TriMet • Colin Maher, TriMet
TRENDS The Other Health Crisis:Keeping People Well • 66% of American adults are overweight or obese • New bike riders lose average of 13 pounds in first year • 71,085 children with asthma in Oregon costing $24 million • Vehicle emissions major contributor • Heart disease and stroke are leading causes of US deaths • 3 hours of riding each week cuts risk in half
TRENDS Second Panel: Health Partnership • Lillian Shirley, Multnomah County Health • Joanne Fairchild, Trauma Nurses Talk Tough • Seth Izenberg MD, Legacy Emanuel Hospital • Rahul Rastogi MD, Emergency Physician, Kaiser Permanente, Medical Director, Livestrong Challenge, Lance Armstrong Foundation
ACTIVE PROJECTS Third Session in Room CActive Projects and Services • TEAM OREGON Motorcycle Safety Program • Legacy Emanuel Trauma Nurses Talk Tough • BTA - Eye to Eye Campaign • Safer Routes to Schools • PDOT safety services • ACTS Oregon • Evergreen Safety Council • Transportation Options • SHIFT 2 BIKES • Elders in Action • Coalition for a Livable Future • Multnomah County Health Department • Telemundo
THANK YOU For coming to the Transportation Safety Summit