Enhancing Quality of Internet-Based Map Services Through User Experience Research
120 likes | 244 Vues
The Map Service Quality Project, funded by the Swedish Internet Fund, investigated user experiences with map services during high network traffic. Researchers from telecom and informatics explored the relationship between measurable service quality and user perception. Key questions addressed how response times and perceived quality could be quantified and managed, as well as how situational context impacts the use of map services. The project aimed to bridge the gap between user expectations and technical performance to improve service delivery in the telecom sector.

Enhancing Quality of Internet-Based Map Services Through User Experience Research
E N D
Presentation Transcript
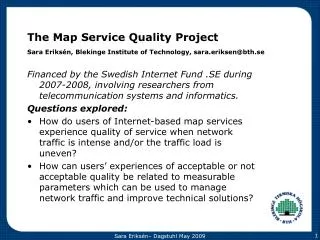
The Map Service Quality ProjectSara Eriksén, Blekinge Institute of Technology, sara.eriksen@bth.se Financed by the Swedish Internet Fund .SE during 2007-2008, involving researchers from telecommunication systems and informatics. Questions explored: • How do users of Internet-based map services experience quality of service when network traffic is intense and/or the traffic load is uneven? • How can users’ experiences of acceptable or not acceptable quality be related to measurable parameters which can be used to manage network traffic and improve technical solutions?
Quality of Experience vs. Quality of Service • Quality of Experience (QoE): Beyond Quality of Service (QoS), as measured from point A to point B, to trying to understand users’ use contexts, use situations, experiences and expectations • Industry rather than academia the driving force • Economical considerations: Dissatisfied customers make improved experienced quality a powerful competitive measure between providers • Focused on actual work practice and use situations, thanks to close contacts with industry and municipality/customer and access to demo version • Quantifying experienced poor quality by relatively simple-to-measure parameters on a network level
The telecom system researchers’ questions: • How can we measure response time as a way of understanding performance and quality of network services? • How does ”objectively” measured quality of service in a network relate to ”subjectively” experienced quality of service according to the user? • How can a user’s perceived quality of service be measured so that the relationship between measured quality of service in the network och perceived quality of service according to the user can be mapped and be taken in to account in performance monitoring?
The Informatics researchers’ questions: • How can the user’s situation and the context of use be considered in design, delivery and management of complex e-services? • How can qualitative user studies inform new models and methods for measuring network traffic and quality of service? • Is it possible to develop an approach to mathematical modelling and engineering where users, situations and contexts are made visible – let us call it ”contextual engineering”? • I.e. to present knowledge from the areas of HCI and CSCW – Human Computer Interaction and Computer Supported Cooperative Work – in a language that is useful for technical engineers?
Service Supply Chain (SSC) within telecom • Services delivered to end users may consist of chains consisting of different subservices which are linked in dynamic, situated and often user-tailored ways. This is a new way of understanding delivery of services within the telecom research domain 1 4 DB Klient Karta 5 7 8 6 DB2 3 2 Pos
Key Performance Indicator: Response time (RT)RT = Tanswer – Tquestion
Key Performance Indicator: Response time (RT)RT = Tanswer – Tquestion Telecom system researchers’ focus: Optimal test environment for refining methods of measuring
Key Performance Indicator: Response time (RT)RT = Tanswer – Tquestion ? The Informatics researchers’ focus: Use of map services in specific work situations and contexts
Users’ experience of response time: 100 ms 1 s 10 s Response time Boring! This is not a worthwhile service! Thoughts begin to wander... Quick response Hmm...a slight delay Reference: Fiedler (2004, 2005), based on Bhatti (2000), Rajamony(2001), Zona (1999) and Nielsen (1994) Measurements during project seem to confirm the picture.