Management of Water Resources in the Melian Basin, Tunisia: Methodology and Case Study Analysis
This document outlines the methodology and findings from the management board meeting discussing the water resource management in the Melian Basin, Tunisia. Using comprehensive data collection techniques, including satellite imagery and socio-economic assessments, the study evaluates the hydrogeological characteristics, water usage in domestic, industrial, and agricultural sectors, and the implementation of WaterWare models. Emphasis is placed on the significance of integrated management approaches to address groundwater depletion and enhance sustainable water usage across the region.

Management of Water Resources in the Melian Basin, Tunisia: Methodology and Case Study Analysis
E N D
Presentation Transcript
OPTIMA PROJECT Third Management Board Meeting, Gumpoldskirchen, Austria, May 18/20, 2006 Tunisia case study By Ahmed EZZINE
Table of Contents METHODOLOGY PRODUCTS / REALIZATION WATERWARE MODELS (RRM & WRM) CONCLUSION
Primary data Collection Satellite map, maps (topo,soil…) Meteorological data Bibliography Socio-economic data Hydrogeologic data Analysis and data Processing Geographic Information Conception WaterWare system IMPLEMENTATION OF RRM & WRM METHODOLOGY
Case Study • Water use • Domestic • Industry • Agriculture Melian basin Increase • Area = 553Km² • Population = 481 960 inhabitants • 4 subcatchments • Dense Drainage network Noeuds • Barrages: El H’ma • 26 mountains lakes • 2500 wells Aquifer • Lithology = plio-quaternary • Groundwater storage = 27.31 MCM/ year • Exploitation = 28.1 MCM / year • Nbre of Bore hole = 494 • State = overexploitated Case study: Melian basin, TUNISIA
PRODUCTS / REALIZATION • A geographic database • 40 vector layers • 6 raster data • 2 land use maps • Hydrogeologic, Hydrologic and Climatologic database in order to determine the: • Hydrological characteristics • Hydrogeological characteristics Input of WaterWare
Geographic database • Soil map • Hydrographic map • Topographicmap • Geologic map • Soil Type • Contour line, road network • Railway, bench mark… • Lithology, tectonic Thematic map Corine land cover Landuse map (1988 & 2000) Land use map • Aerial photos 2000 • Spot image 1988
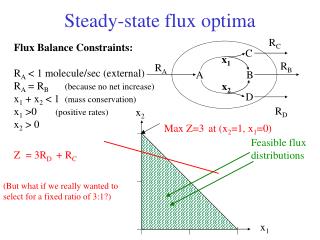
Hydrography Elevation 0-77m 77-155m 155-233m 233-311m 311-389m 389-467m 467-545m 545-622m 622-700m Hydrologic study of the catchment areas Catchment geometry Catchment relief Drainage network Water inflow in the catchments Digital Elevation Model of the drainage basin of Melian
Aerial photography Spot XS Photo-interpretation and classification Corine land cover legend Agricultural areas environment Artificial Surface environment Natural areas Urban fabric Industrial, commercial area Dump and mine Arable land Permanent crops Pastures Heterogeneous agricultural Forest Water bodies LAND USE MAP The methodology of the cartographic edition Land Use map
No change Change Land Use Change
Hydrogeologic Information System Hydrologic data Hydrogeologic data Environmental data Meteorological data • Characteristics of 2460 Well • Treatment station plant Generality of STEP Affluents STEP Effluents STEP • Climat data: Temperature Rainfall Wind Evaporation • Management of the catchments area • Hydrogeologic characteristics of the Groundwater • Management of the regions • Determination of the hydrologic characteristics • Dams and lakes characteristics • Calculate the inflow Water in each Catchment Hydrogeologic Information System(HIS)
GIS data Environmental data Meteorological data Hydrogeologic data Hydrologic data Main interface of the HIS
Interest of the Hydrogeologic Information System • A Data Bank with a maximum of data about region’s feature (hydrological, hydrogeological, environmental, meteorological, soil, GIS data…) • Regroup and organize data in the same frame. The scatting of the hydrogeological data about the catchment area will be a hurdle behind researches • We can manage a SHP files without using ArcView • Simulation of water inflow in the catchment • Conception allowing making additions of new frames and modules • Update will be very easy since data will be centralized
WATERWARE MODELS (RRM & WRM)
Water nodes • Collection of 2500 wells built in the case study: complete information is available concerning: wells depth, diameter, usage, exploitation, equipment, standing water level, dry residue… • Dams: name, coordinates , sector, year of construction, storage capacity, irrigated area, inflow water, name of catchment… • Collection of historic data related to observation wells in the groundwater • Mountains Lakes: name, coordinates, realization year, name of catchment, area of the catchment, storage capacity, delegation… • Observation well: name, coordinates, year, dry residue, standing water level… • Collection of hydrologic, hydrogeologic and meteorologic data
Topologic model Melian basin Demand node Hma basin Melah basin End node Start node Rmel basin Treatment node Reservoir node Medgerda Canal Hma reservoir Irrigation Groundwater Tourristic Domestic Industry TP Sea
Planned Work • Refinement and updating of GIS data base • Try to run the WRM model with new time series collected from stakholders • Identification and analysis of indicators (physical & economic) and investigation of water quality related impacts • Optimisation scenarios • WP04 Water Technologies • Dissemination of experience and results on the local and international scales.
CONCLUSIONS Realized works: • Geographic database • 40 layers SHP and 6 raster data • Two Land use map (1988 & 2000) • Land Use Change map • Hydrogeological database • Information about 2460 wells (depht, standing water level, salinity,…) • Information about the groundwater (phreatic and profond) • Information about nodes: • Lake, dam… • Observation well, bore hole… • Vectors layers and raster data technicalreport • Hydrological technical report • Determination of the inputs user in WaterWare
Realized works: • Establish the Stakholders database • Topologic model of the basin has been identified • Implementation of RRM and WRM model • GIS data sent to NCRS • Stakeholders Workshop