Download
1 / 19
210 likes | 461 Vues
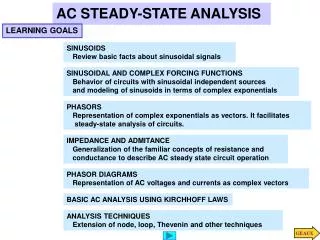
Steady-state flux optima. R C. Flux Balance Constraints: R A < 1 molecule/sec (external) R A = R B (because no net increase) x 1 + x 2 < 1 (mass conservation) x 1 >0 (positive rates) x 2 > 0. C. x 1. R B. R A. A. B. x 2. D. R D. x 2. Max Z=3 at (x 2 =1, x 1 =0).

E N D
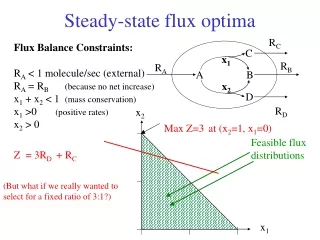
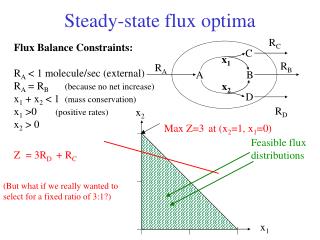
Steady-state flux optima RC Flux Balance Constraints: RA< 1 molecule/sec (external) RA = RB(because no net increase) x1 + x2< 1 (mass conservation) x1 >0 (positive rates) x2 > 0 C x1 RB RA A B x2 D RD x2 Max Z=3 at (x2=1, x1=0) Feasible flux distributions Z = 3RD + RC (But what if we really wanted to select for a fixed ratio of 3:1?) x1
FBA - Linear Program • For growth, define a growth flux where a linear combination of monomer (M) fluxes reflects the known ratios (d) of the monomers in the final cell polymers. • A linear programming finds a solution to the equations below, while minimizing an objective function (Z). Typically Z= ngrowth (or production of a key compound). • i reactions
Biomass Composition ATP GLY LEU coeff. in growth reaction ACCOA NADH FAD SUCCOA COA metabolites
Flux ratios at each branch point yields optimal polymer composition for replication x,y are two of the 100s of flux dimensions
C009-limited 200 WT (LP) 180 7 8 160 140 9 120 10 Predicted Fluxes r=0.91 p=8e-8 100 11 14 13 12 3 1 80 60 40 16 20 2 6 5 15 4 17 18 0 0 50 100 150 200 Experimental Fluxes 250 250 Dpyk (LP) Dpyk (QP) 200 200 18 7 r=0.56 P=7e-3 8 r=-0.06 p=6e-1 150 150 7 8 2 Predicted Fluxes Predicted Fluxes 10 9 13 100 9 100 11 12 3 1 14 10 14 13 11 12 3 50 50 5 6 4 16 16 2 15 5 6 18 17 15 17 0 0 4 1 -50 -50 -50 0 50 100 150 200 250 -50 0 50 100 150 200 250 Experimental Fluxes Experimental Fluxes
Competitive growth data: reproducibility Correlation between two selection experiments Badarinarayana, et al. Nature Biotech.19: 1060
Competitive growth data On minimal media negative small selection effect C 2 p-values 4x10⁻³ 1x10⁻⁵ LP QP Novel redundancies Position effects Hypothesis: next optima are achieved by regulation of activities.
C.ph Tolonen Alcohol resistance E.coReppas/Lin Trp/Tyr exchange E.co Lenski Citrate utilization E.co Palsson Glycerol utilization E.co Edwards Radiation resistance E.co Ingram Lactate production E.co Stephanopoulos Ethanol resistance E.co Marliere Thermotolerance M.tb J&J Diarylquinoline resistance E.co DuPont 1,3-propanediol production Lab evolution optimization
Non-optimal evolves to optimal Ibarra et al.Nature. 2002 Nov 14;420(6912):186-9. Escherichia coli K-12 undergoes adaptive evolution to achieve in silico predicted optimal growth.
Cross-feeding symbiotic systems:aphids & Buchnera • obligate mutualism • nutritional interactions: amino acids and vitamins • established 200-250 million years ago • close relative of E. coli with tiny genome (641kb) Internal view of the aphid. (by T. Sasaki) Bacteriocyte (Photo by T. Fukatsu) Buchnera (Photo by M. Morioka) Aphids http://buchnera.gsc.riken.go.jp
Shigenobu et al. Genome sequence of the endocellular bacterial symbiont of aphids Buchnera sp.APS. Nature 407, 81-86 (2000).
Trp & Tyr (key pharma precursors)Cross-feeding synthetic ecosystem(syntrophic co-culture)
Covariance in lab evolution Second Passage First Passage trp/tyrA pair of genomes shows the best co-growth Reppas, Lin & Church ; Shendure et al. Accurate Multiplex Polony Sequencing of an Evolved Bacterial Genome(2005) Science 309:1728
Sequence monitoring of evolution(optimize transport & drug resistance) Sequence Reppas, Lin & Church
Evolved syntrophic strain pairs Trp D Tyr D
-12 -11 -10 -9 -8 -7 -6 Reading lab-evolved genomessequenced across time & within each time-point Independent lines of TrpD & TyrD co-culture 5 OmpF: (pore: large,hydrophilic > small) 42R-> G,L,C, 113 D->V, 117 E->A 2 Promoter: (cis-regulator) -12A->C, -35 C->A 5 Lrp: (trans-regulator) 1bD, 9bD, 8bD, IS2 insert, R->L in DBD. At late times TyrD becomes prototrophic! Reppas, Shendure, Porecca
Resynthesis of mutant combinations---Additive effects insensitive to order of mutation