Steady State
(N=10). Treatment A:. ATV 400 mg QD. +. LPV/r BID Placebo. (N=10). Treatment B:. LPV/r 400/100 mg BID. +. ATV QD Placebo. (N=10). Treatment C:. ATV QD Placebo. +. LPV/r BID Placebo. Clamp. or. A. CLAMP (180 min) + PK Profile. B. C. CLAMP (180 min) + PK Profile. (n=20).

Steady State
E N D
Presentation Transcript
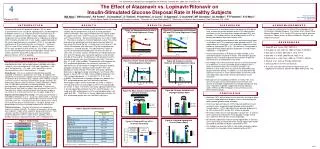
(N=10) Treatment A: ATV 400 mg QD + LPV/r BID Placebo (N=10) Treatment B: LPV/r 400/100 mg BID + ATV QD Placebo (N=10) Treatment C: ATV QD Placebo + LPV/r BID Placebo Clamp or A CLAMP (180 min) + PK Profile B C CLAMP (180 min) + PK Profile (n=20) Study Population N= 30 OR (n=20) or A C B Male 100% OR Median Age (years) 35 (range 19-49) Weight (kg) 76.4 9.9 C or A B BMI (kg/m2) 24.0 2.4 LPV Mean EC50 =17 ng/mL 1 - 5 6 WASHOUT 7 days 14 19 Fasting Plasma Glucose (mg/dl) 78.0 4.4 Day Mean wild-type EC50 =4 ng/mL Fasting Serum Insulin (IU/mL) 6.3 3.3 Total Cholesterol (mg/dl) 176 15 HDL Cholesterol (mg/dl) 52 5 LDL Cholesterol (mg/dl) 102 10 Fasting Triglycerides (mg/dl) 108 25 Analysis by Treatment P=0.008 Steady State Steady State P=N.S. P=0.010 12.0 9.88±0.84 9.80±0.84 10.0 7.52±0.84 LPV/r (n=20) ATV (n=20) 8.0 Placebo (n=20) 6.0 mg/Kg*min per microIU/ml 4.0 2.0 0.0 Clamp P=0.006 6 P=0.003 P=N.S. 5 3.85 4.00 P=N.S. 4 Table 1: Baseline Characteristics LPV/r (n=20) 2.54 P=N.S. P=N.S. ATV (n=20) mg/Kg/min 3 Placebo (n=20) 1.75 1.72 1.66 2 1 Glucose Oxidation Rate Glycogen Storage Rate 0 Figure 1: Study Design P< 0.001 250 P< 0.001 Insulin-Stimulated Glucose Disposal Rate per unit of Insulin (mg/Kg*min per U/mL) Glycogen StorageRate(mg/Kg*min) 50 177 171 165 P=NS 200 30 159 LPV/r LPV/r (n=20) 131 + 4% 124 10 150 ATV ATV (n=20) P=N.S. mg/dl 97 % Change Relative to Placebo Placebo 91 91 < 1% -10 P=N.S. 100 42 42 -30 40 - 24% Data presented as mean Standard Deviation, unless stated otherwise 50 P=0.008 - 34% -50 P=0.006 TC LDL HDL TG 0 11th Conference on Retroviruses and Opportunistic Infections, February 8-11, 2004; San Francisco, CA The Effect of Atazanavir vs. Lopinavir/Ritonavir on Insulin-Stimulated Glucose Disposal Rate in Healthy Subjects MA Noor1, DM Grasela1, RA Parker1, U Chaudhari1, D Tackett1, H Uderman1, A Currie1, S Agarwala1, C Grunfeld2, MF Giordano3, SL Hodder1, FT Fiedorek1, E O’Mara1 Bristol-Myers Squibb Pharmaceutical Research Institute, 1Princeton NJ, and 3Wallingford CT, 2University of California San Francisco, San Francisco, CA, USA 4 Mustafa A. Noor, M.D. Phone: (609) 818-4364/ 897-5483 Fax: (609)897-6068 E-mail: mustafa.noor@bms.com Poster # 702 I N T R O D U C T I O N R E S U L T S R E S U L T S (Cont’d) D I S C U S S I O N A C K N O W L E D G M E N T S Treatment with some HIV protease inhibitors (PI) has been associated with insulin resistance, hyperglycemia, and development of diabetes mellitus (1,2). Induction of insulin resistance by a PI precedes any significant changes in lipids, lipoproteins, or body composition (3) and can be detected after a single dose of indinavir (IDV) in healthy volunteers(4). In vitro studies suggest blockade of the insulin-regulated glucose transporter, GLUT-4, as a possible mechanism for PI-associated insulin resistance (5). Atazanavir (ATV) is a new PI that, unlike IDV, lopinavir (LPV), and ritonavir (RTV), does not block GLUT4 activity (6). This studies assesses insulin-stimulated glucose disposal and glycogen storage rates in healthy volunteers taking ATV compared to those taking lopinavir/ritonavir (LPV/r) or placebo. Thirty six subjects were enrolled and 30 completed the study. Five subjects did not complete the study due to clamp procedure technical difficulties; one subject failed to return for repeat studies. All subjects were male; 14 were Caucasian, 9 African-American and 7 Hispanic/Latino. Baseline characteristics are listed in (Table 1). There were no adverse clinical or laboratory events. The clamp procedure was performed near peak plasma concentrations for each drug (Fig 2a and Fig 2b). A steady-state insulin level of 65 IU/ml was achieved after 30 minutes (Fig 3a) and glucose was clamped at 75 mg/dl (Fig 3b). The adjusted mean values of insulin-stimulated glucose disposal per unit of insulin (M/I) for LPV/r, ATV are shown (Fig 4a). The difference in M/I between the ATV and LPV/r groups was statistically significant (2.28 with 95% CI: 0.58, 3.97; p=0.010). The difference in M/I between the LPV/r and placebo groups was also statistically significant (-2.35 with 95% CI: -4.05, -0.66; p=0.008). The difference in M/I between the ATV and placebo group was not statistically significant. The adjusted means of non-oxidative component of glucose disposal (glycogen storage) for individuals receiving LPV/r, ATV and placebo are shown (Fig 4b). There were statistically significant differences in glycogen storage rate between the ATV and LPV/r groups (1.46 with 95% CI: 0.55, 2.36; p=0.003) and between the LPV/r and placebo groups (-1.31 with 95% CI: -2.22, -0.40; p=0.006). The difference in glycogen storage rates between the ATV and placebo groups was not statistically significant. Percentage changes relative to placebo are shown in Figure 5. The adjusted means of fasting lipids for LPV/r, ATV and placebo are shown in Fig 6. There were statistically significant differences in fasting triglycerides between the LPV/r and ATV groups (-46 mg/dl, p<0.001) and between the LPV/r and placebo groups (+53 mg/dl, p<0.001). The different in fasting triglycerides between the ATV and placebo groups was not statistically significant. • Consistent with in vitro observations, we found that ATV did not have an effect on glucose disposal while LPV/r administration resulted in insulin resistance when compared to both ATV and placebo. This finding confirms the favorable profile of ATV on glucose metabolism observed in clinical trials. • Insulin-stimulated glucose disposal rates were consistently lower in individuals on LPV/r compared to both placebo and ATV. The magnitude of this effect was ~24% and within range of the effect previously reported on IDV (4,5). The decrease is comparable in magnitude to total hepatic glucose production in fasted healthy individuals (~ 2 mg/kg/min). • Plasma concentrations of PI drugs are highly variable as are individual subjects’ sensitivity to insulin. We measured glucose disposal rates near peak of plasma concentration for lopinavir and atazanavir at comparable insulin levels. • Our findings are in contrast to those by Lee et al who found little or no decrease in insulin-stimulated glucose disposal after 4 weeks of treatment with LPV/r in healthy volunteers (8). However, in that study insulin resistance was detected by oral glucose tolerance testing. In addition, Lee et al also observed significant increases in serum concentrations of free fatty acids and triglycerides, both known to be associated with insulin resistance. • Although we have studied acute effects in healthy men, long-term results from clinical trials indicate that the extent and severity of metabolic complications are compounded by HIV and occur regardless of gender, suggesting clinically important adverse effects of ARV therapy on insulin sensitivity across diverse patient groups. • This work was performed at the Clinical Pharmacology Unit of Bristol-Myers Squibb Company. The authors thank Bruce Oliver, Marylou Bourgeois, R.N., and the CPU nursing staff for technical assistance. Special thanks to Melissa McManus, PharmD., for editorial assistance. Figure 2b: Pharmacokinetic Profiles of LPV and RTV During Euglycemic Clamp Figure 2a: Pharmacokinetic Profile of ATV During Euglycemic Clamp R E F E R E N C E S 1. Dube MP et al. Lancet 1997; 350:713-4. 2. Grinspoon S.. Clin Infect Dis. 2003; 37 Suppl 2: S85-90.3. 3. Noor MA, et al AIDS. 2001 May 4; 15(7): F11-8. 4. Noor MA, et al AIDS. 2002 Mar 29; 16(5): F1-8. 5. Murata H et al. J Biol Chem. 2000 Jul 7; 275(27): 20251-4. 6. Wang S, et al. Antiviral Therapy 2003; 8:L36. 7. DeFronzo RA, et al 1979; 237:E214-23. 8. G. A. Lee, et al 10th Conference on Retroviruses and Opportunistic Infections, Boston, MA 2003, Abstract No. 748. LPV/r administered in fasted state on Day 6 ATV administered in fasted state on Day 6 M E T H O D S Figure 3b: Glucose Levels By Treatment During Euglycemic Clamp Figure 3a: Insulin Levels by Treatment During Euglycemic Clamp After giving informed consent, healthy HIV- seronegative volunteers enrolled into the study. We excluded subjects with body mass index >30 kg/m2, serum total cholesterol > 240 mg/dl triglycerides > 200 mg/dl, fasting glucose > 126 mg/dl , serum aspartate or alanine aminotransferases >50 U/l and creatinine >1.4 mg/dl. Study Design: This was a randomized, double-blind, placebo-controlled, 3-treatment, 2-period cross-over study. All subjects were admitted to the Bristol-Myers Squibb Clinical Pharmacology Unit (CPU) as inpatients for 6 consecutive days. Subjects were randomly assigned to receive atazanavir (Reyataz Bristol-Myers Squibb, Princeton, NJ) 400 mg daily, lopinavir/ritonavir (Kaletra, Abbot Laboratories, Abbott Park, IL) 400/100 mg twice daily, or matching placebo. On the morning of day 6, a glucose clamp was performed. Treatment was discontinued on day 7and the subjects were discharged from the CPU. Two week later subjects returned at which time they were randomly crossed over to an alternate treatment arm for repeat studies(Fig 1). Hyperinsulinemic Euglycemic Clamp: The clamp was performed as described by DeFronzo et al (7). Insulin was administered as a primed continuous intravenous infusion, followed by a constant infusion at the rate of 40 U/m2min. A variable infusion of 20% dextrose was used to maintain plasma glucose concentration at ~75 mg/dl. Steady state glucose disposal rate was calculated between 60 to 180 minutes. Statistical Analyses: The effect of treatment was compared by analysis of variance (ANOVA). The factors in the analysis of variance were sequence, subject within sequence, period and treatment. Point estimates and 95% confidence intervals were constructed for treatment differences (ATV vs. LPV/r, ATV vs. placebo, LPV/r vs. placebo). All data are adjusted meanSE unless stated otherwise. Figure 4b: Glucose Oxidation and Glycogen Storage Rates Figure 4a: Mean Glucose Disposal Rate per Unit of Insulin C O N C L U S I O N • Atazanavir (ATV) did not affect insulin sensitivity and had no effect on insulin-mediated glucose disposal rates as measured by the gold-standard glucose clamp technique. • In contrast, lopinavir/ritonavir (LPV/r) induced significant insulin resistance when compared to both placebo-treated and ATV-treated subjects. LPV/r reduced the mean glucose disposal rate by 23% relative to ATV and by 24% relative to placebo. • ATV had no effect on the mean glycogen storage rate. In contrast, LPV/r significantly reduced the mean glycogen storage rate by 36% relative to ATV and 34% relative to placebo. • ATV did not significantly increase fasting triglycerides. In contrast, LPV/r significantly increased the mean fasting triglycerides by 43% compared to placebo and by 35% compared to ATV. • Our findings are consistent with in vitro studies of glucose uptake and confirm the favorable clinical metabolic profile of ATV. Figure 5: Effect of ATV vs. LPV/r on Insulin Sensitivity Figure 6: Lipid and Lipoproteins Prior to Clamp (Day 6) 04-005