Download
1 / 49
500 likes | 767 Vues
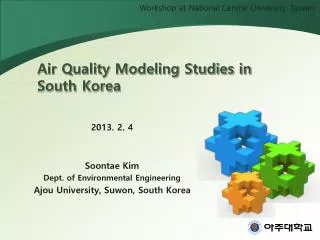
Workshop at National Central University, Taiwan. Air Quality Modeling Studies in South Korea. 2013. 2. 4 Soontae Kim Dept. of Environmental Engineering Ajou University, Suwon, South Korea. Ozone season in Houston February ~ November. Air Quality Forecasting System

E N D
Workshop at National Central University, Taiwan Air Quality Modeling Studies in South Korea 2013. 2. 4 Soontae Kim Dept. of Environmental Engineering Ajou University, Suwon, South Korea
Ozone season in Houston February ~ November Air Quality Forecasting System Long-range Transport of Air Pollutants PM, NO2, and Ozone SIP over Seoul Metropolitan Area
Air Quality Forecasting in Ajou University GFS downloading - UM - FNL • AERO6 • (Heavy Metals) CMAQ WRF & MCIP • Flexi-nesting • UCM • Physical options • SST CAMx PCA IDL MEGAN SMOKE DDM • BEIS3 • Fire Emission Merge Web BFM Emissions Sulfate Tracking Exposure w/ Population
Input preparation SMOKE processing Input data • Format conversion • DB/ASCII IDA • SCC mapping • Split factors for • chemical speciation • Temporal profiles • Surrogates • Spatial allocation for • county-based emissions Spatial allocation ; domain-specific Temporal allocation ; hourly resolved emissions Chemical speciation ; CB4, SAPRC99, RADM2 Plume rise ; w/ meteorology Area AQM Annual Nonroad Annual Mobile MIMS Spatial Allocator Annual Emissions Shape files Point Annual, Monthly SMOKE w/ Korean NEI Korean Emissions Inventory Processing using the US EPA's SMOKE System (2008), Asian Journal of Atmospheric Environment, 2(1), 34-46. Sparse Matrix Operator Kernel for Emissions
Daily AQF Schedule AQF w/ GFS Data download: 15 KST (updated between 14 KST ~ 15 KST) 48-hrForecasting: Ex) Jun 8th 00 KST ~ Jun 10th 00 KST → Jun 7th 15 UTC ~ Jun 9th 15 UTC) 00 KST 09 KST 00 KST 09 KST 00 KST 09 KST 12 UTC 12 UTC 12 UTC 00 UTC 00 UTC 00 UTC WRF / MCIP (60hr) CMAQ / SMOKE / MEGAN (57hr) 3 1 2 First day Second day Diagnostic Models (24hr)
Systematic Bias Correction for AQI 5/2~11/29
Sulfate & Sensitivity to SOx emissions - DDM ASO4 1st-order sensitivity (surface layer) China SOx S. Korea SOx Japan SOx
Sulfate Tracking ASO4 ASO4 EMI ASO4 GAS ASO4 ICBC ASO4 OX
NOX Iso-surface over SMA June 4, 2004 at 02 KST Iso-surface: 30 ppb Seoul Major point sources
Horizontal & Vertical Ozone over SMA http://venus.ajou.ac.kr/aqf/AQFv1/ NO + O3 NO2 + O3 Vertical mixing up to ~2.5 km High O3 Strong O3 titration June 4, 2004 at 13 KST
Contribution and Sensitivity • Consider a chemical species X that has two sources A and B (so X = xA+ xB) and which undergoes a second order self-reaction with rate constant k. Environ (2010) • The homogeneous rate terms kxA2and kxB2 clearly describe chemical change for pollutants from sources A and B (xAand xB), • But the inhomogeneous rate term 2kxAxBis not uniquely associated with either source A or B. Ajou University AQML
Emissions, Meteorology, IC/BC, etc. ∆ (e.g., Seoul Emissions) CMAQ CMAQ-HDDM Concentrations Sensitivities ∆ Check scientific understanding Extend beyond observations Forecasting and prediction Atmospheric response Control strategies Source apportionment Cohan et al. (2005)
Sensitivity Analysis • Sensitivity coefficients ( = ) • Control strategy ( ) • Source apportionment (++) Ajou University AQML
Sensitivity Coefficients explains local sensitivity S(1)= Cbase Concentration S(1) > 0 S(1) < 0 S(1) = 0 Emission Ebase
Sensitivity Coefficients • BFM (Brute Force Method) • HDDM (High-order Decoupled Direct Method) Ajou University AQML
Sensitivity Coefficients SHDDM(1)= C(+10%) △C C(base) Concentration SBF(1)= C(-10%) -△εE(base) △εE(base) △E Emission E(-10%) E(base) E(+10%)
Ozone 1st-Order Sensitivity Coefficients VOC NOx Kim (2011) BFM HDDM Ajou University AQML
Sensitivity Coefficients SHDDM(2)= SHDDM(1)= C(+10%) △C C(base) Concentration SBF(1)= C(-10%) = -△εE(base) △εE(base) △E Emission E(-10%) E(base) E(+10%)
Ozone 2nd-Order Sensitivity Coefficients NOx Kim (2011) BFM HDDM Ajou University AQML
Ozone 2nd-Order Sensitivity Coefficients VOC Kim (2011) BFM HDDM Ajou University AQML
Sensitivity Coefficients: BFM vs HDDM Kim (2011) Ajou University AQML
Control Strategy explains change in concentration after a emissions reduction plan Cbase Concentration △C CP BFM: C(base), C(p), … △E HDDM: ) EP Ebase Emission
Control Strategy In case more than two emissions are to be reduced, cross sensitivity is required Kim et al. (2011) Ajou University AQML
Source Apportionment Zero-out Contribution of a target emission • Need to check if VOC-limited or NOx-limited • A large perturbation may go across the regime Cbase Kim et al. (2011) Concentration △C = ZOC CP △E (= a target emission) Ebase Emission EP
Ozone Simulations over the SMA Kim et al. (2011) Ajou University AQML
NOx and VOC reductions: BFM vs HDDM Kim et al. (2011) NOx VOC Ajou University AQML
NOx and VOC reductions: BFM vs HDDM Kim et al. (2011) Truck emissions ~ 25% NOx emissions from the SMA Ajou University AQML
June 3rd, 2000 at 21 KST Contributions to NOx Concentrations Anthropogenic emissions: Emissions from Seoul, Gyeonggi, and Incheon (SMA) only Biogenic emissions: Domain-wide Contributions to NOx Concentrations NO Conc. Area source Mobile source NO2 Conc. Point source Biogenic emissions
Contributions to Daily Max NOx Concentrations Averaged over Seoul Metropolitan Area (SMA) & Seoul June 3rd~10th, 2004
June 4th, 2004 at 15 KST Contributions to O3 Concentrations Anthropogenic emissions: Emissions from Seoul, Gyeonggi, and Incheon (SMA) only Biogenic emissions: Domain-wide Contributions to O3 Concentrations Area Mobile O3 Conc. Point Biogenic Boundary Mobile (+area) sources the major reduction factor for ozone over Seoul
Contributions to Daily Max O3 Concentrations Averaged over Seoul Metropolitan Area & Seoul Note: Boundary conditions (> 50%) and cross-terms are not shown. June 3rd~4th, 2004
June 4th, 2004 at 15 KST Contributions to O3 Concentrations Biogenic emissions are excluded Contributions to O3 Concentrations O3 Conc. Seoul Emissions Gyeonggi Emissions Incheon Emissions Seoul + Gyeonggi The cross-term (Seoul + Gyeonggi) becomes important to explain O3 over Southern Gyeonggi
Contributions to Daily Max O3 Concentrations Biogenic emissions are excluded NO + O3 NO2 + O3 NO2 NO + O O + O2 O3 June 3rd~4th, 2004
Changes in Daily Max O3 Concentrations After anthropogenic VOC emission reductions for Seoul Metropolitan Area June 3rd, 2004 June 4th, 2004
Itahashi et al. (2012) Ajou University AQML