Regional Air Quality Modeling
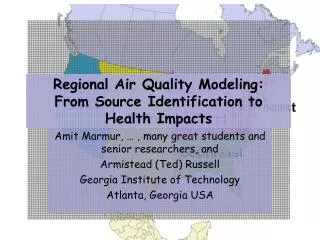
Regional Air Quality Modeling. Patrick Barickman, Air Quality Modeler Tyler Cruickshank, Meteorologist/Modeler Utah Department of Environmental Quality Division of Air Quality October 23, 2003. Visibility Science, Modeling, and the Western Regional Air Partnership.


Regional Air Quality Modeling
E N D
Presentation Transcript
Regional Air Quality Modeling Patrick Barickman, Air Quality Modeler Tyler Cruickshank, Meteorologist/Modeler Utah Department of Environmental Quality Division of Air Quality October 23, 2003
Visibility Science, Modeling, and the Western Regional Air Partnership
1977 Clean Air Act Amendments • PSD (new, modified sources) • Visibility Protection Program (existing sources) • 1990 Clean Air Act Amendments • Regional Haze • Visibility Transport Commissions • Address haze and visibility in all the national parks • GCVTC 1996 GCVTC Recommendations Published 1997 WRAP Established to implement the recommendations and Assist the States in creating the Regional Haze Plans
GCVTC Recommendations are also the major issues addressed in Utah’s Regional Haze State Implementation Plan due 12/31/03 • Pollution Prevention • Clean Air Corridors • Stationary Sources – regional targets for SO2 emissions • Sources of pollution in and near the Parks • Mobile – automobile emissions • Road Dust – research on the characterization and effects • Emissions from Mexico
Light,Waves, Energy, radiation, photons – all the same. Our eyes see only a tiny fraction of the full radiation spectrum. The radiation spectrum is defined by wavelength. Our eyes see different radiation wavelengths as color.
•3 General particle size ranges in our atmosphere … • Accumulation size particles stay in the atmosphere for a long time. • Note, that the accumulation size corresponds to the wavelength of visible light. • Smaller accumulation mode particles close to the wavelength of blue light. • Larger accumulation mode particles close to the wavelength of red light.
Particle size determines the amount of scattering. Scattering efficiency greatest when particles are the same size as the radiation wavelength. Coarse Size Molecular Size
Particles in the accumulation mode do the most scattering. More mass but fewer particles. Less mass but more particles.
How small is a Accumulation Mode particle ??? Accumulation Mode
Particles with diameters similar to light wavelengths do the best scattering. Our Clean Atmosphere – Small particles = Blue Sky Our Dirty Atmosphere … Larger particles = Grayish Sky
What are the scatterers in our atmosphere? •Molecular sizes rapidly become accumulation size. Molecular Size Accumulation Size
Pollution particles enter into the accumulation mode size. The eastern United States has bigger sulfate particles due to humidity.
Visibility depends on where you are standing and looking in relation to the sun! Looks the same on both sides. Looks dark on this side. Looks bright white on this side.
Low sun angle High sun angle
•Perceived Air Quality changes during the day as the sun changes position.
The amount of light reflected from a vista that makes it to your eye determines … VISIBILITY.
•Different geographic regions and seasons have different sizes and types of particles.
Light Extinction Visibility
Components of Visibility Degradation on the Colorado Plateau 1989 – 1999 as Measured at 6 Locations ( 20% Worst Days ) 1996 Inventory - 9 Transport States, All Sources 1996 SO2 Inventory
Point Source SO2 – 1996, 2018 Base Year, 2018 Milestone 17% Reduction in Point Source SO2 From 1996 to 2018 Base Year 21% reductionin Point Source SO2 From the 2018 Base Year to the 2018 Milestone Inventory Reduction in Electric Utility SO2 = 32%
Components of Visibility Degradation on the Colorado Plateau 1989 – 1999 as Measured at 6 Locations ( 20% Worst Days ) Variation in Sulfate Contribution to Visibility Degradation During the 20% Worst Days 1989 - 1999
SO4 OC Correlation between wildfire intensity and the SO4/OC contribution to Bext on the Colorado Plateau.
Sources: 1) Introduction To Visibility. William C. Malm, May 1999 Air Resources Division National Park Service Cooperative Institute for Research in the Atmosphere http://vista.cira.colostate.edu/improve/Education/IntroToVisinstr.htm 2) Improve: Annual Light Extinction Group 10, 50, 90 http://vista.cira.colostate.edu/DatawareHouse/IMPROVE/Data/SummaryData/RECONBEXT_annual.TXT 3) Projections Report for the 2018 Base Case Emission Inventory Pechan, May 2002 on WRAP emissions forum page 4) Spreadsheets for various inventory components located on the WRAP Emissions Forum page 5) Interagency situation reports for U.S. wildfires. http://www.nifc.gov/news/nicc.html 6) http://vista.cira.colostate.edu/views/ 7) http://www.wrapair.org/