Download
1 / 53
530 likes | 668 Vues
Collaboration to Close the Achievement Gap & Increase Diversity CALIFORNIA ALL. EN Banc Hearing Los Angeles September 25, 2007. Today’s Presentation. Today’s Presentation. Russlynn Ali, Director, Education Trust West

E N D
Collaboration to Close the Achievement Gap & Increase Diversity CALIFORNIA ALL EN Banc Hearing Los Angeles September 25, 2007
Today’s Presentation • Russlynn Ali, Director, Education Trust West • Henry Mendoza, Immediate Past Chairman, California Hispanic Chambers of Commerce • Sarah Redfield, Visiting University Profession, University of the Pacific, McGeorge School of Law, Moderator
Demographics and Workforce CONTEXT
US Population 2005 2050 Richard Gambitta Rocky Mountain Diversity Summit Total will exceed 100% due to Hispanic, non-white count
The Professions Adapted from ABA Miles to Go 2004
US Population / Legal Kent Lollis, LSAC, StreetLaw Presentation; Dr. Gambitta, Rocky Mountain Diversity Summit Presentation
Law / Leadership of the Nation • 100% judges • 58% U.S. Senators • 37% U.S. Reps • 20% state legislators • 11% major CEOs Pathway to leadership 90% White http://www.yourcongress.com/ViewArticle.asp?article_id=1671
e.g. Leaking Pipeline to Law School Kent Lollis, LSAC Presentation
Race/Ethnicity Stats CA BAR State Bar of California Diversity Pipeline Project
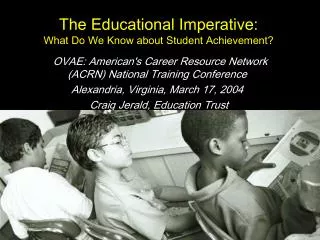
Russlynn Ali P12 & the Achievement Gap
The Problem Starts Early • > Black children expelled from preschool • Low income 3-year-olds = smaller vocabularies • Black/ Hispanic children less likely know their letters @ kindergarten. EdTrust data; Yale Child Study; American’s Kindergartners
And Does Not Improve • By high school 17 year old Black & Latino students read at the rate of 13 year old whites. National Center for Education Statistics NAEP2004 Long Term Trends/ Education Trust / NYT
The Facts The Numbers by Graduation Three of these students will not graduate from high school. Seven out of ten eighth-grade students cannot read at grade level. Three of these students will not graduate from high school with the skills necessary for success in higher education or the modern workforce. Alliance for Excellent Education, Wise Presentation, Ed Law Conference 2007
On-time High School Graduation 50%/ 40% drop out factories Ed Week, EPE Research Center, Diploma Counts 2006, uses the Cumulative Promotion Index (CPI). Class of 03
California Graduation • California graduation less than national rate and drop out rate higher than national rate • Black and Latino students are 3x more likely than White to attend “drop out factories” • In LA 48% Black + Latino starting 9th grade finish 12th • Black + Latino youth high school graduates from LAUSD, one in five A-G requirements to qualify for admission 4-year public California university. California Dropout Research Project SB 1; Civiil Rights Project CONFRONTING THE GRADUATION RATE CRISIS IN CALIFORNIA
College ready? ACT, Rigor at Risk; USDOE, Condition of Education
College + Infoplease.com, US Census 2005, ABA, Condition of Education
A note on Socioeconomics Not always
A note on civics • “evidence of a profound civic achievement gap between poor, minority, and immigrant youth and adults, on the one hand, and middle-class or wealthy, white and native-born youth and adults on the other…” • And not improving • 8th and 12th grade no improvement from 1998 Meira Levinson, The Civic Achievement Gap ABA LRE Conference
Why is the pipeline leaking? Rigor (1) • Students most placed at risk more often have • Least experienced and effective teachers • Lowest number of rigorous courses • Lowest grade and rigor expectations in school • Are not engaged… Education Trust, Unnamed school district in California, 2002-03 school year.
Relationships/Teaching High povertyLow poverty High minority Low minority *Teachers lacking a college major or minor in the field. Data for secondary-level core academic classes. Richard M. Ingersoll, University of Pennsylvania. Original analysis for the Ed Trust of 1999-2000 Schools and Staffing Survey.
Relationships/Teaching *Teachers with 3 or fewer years of experience. “High” and “low” refer to top and bottom quartiles. Source: National Center for Education Statistics, “Monitoring Quality: An Indicators Report,” December 2000.
Henry Mendoza 16 to the profession
Latino Success in Higher Education – Assuring California’s FutureSeptember 25, 2007 Presented by Henry Mendoza, CPA Immediate Past Chairman of the Board California Hispanic Chambers of Commerce
Overview • Critical Issues: • Economic competition • Necessity of a higher education degree • Projected population growth of Latino segment • Educational attainment levels • Increasing numbers of low-income potential college students
Demographics • Latinos makeup approximately 33% of the population • Latinos are projected to become the largest racial or ethnic group by 2011 and to constitute a majority by 2040 in California • 33% of all Latino high school students drop out of school. In some areas it is higher than 50% • Only 10% of Latinos graduate from 4 year colleges and universities • That is 6% - 10% (This has not changed in 25 years) • By 2020, the share of the California workforce this is Latino is expected to jump to 38% • The total college age population in California is projected to increase by 27% in 2014
College Enrollment • California is ranked 49th among the 50 states in the percentage of high school seniors who enroll in baccalaureate-granting colleges • In 2006-2007, Latino enrollment is 31% in California community colleges, 23% in the CSU system and 10% for the UC system
Financial Aid • 75% of young adults not enrolled in college would have been more likely to attend college had they been exposed to better information about financial aid, especially during K-12 • More than 50% of Latino parents and 43% of Latino college age students cannot name a single source of financial aid to pay for college • Latinos receive an average aid award of $4,945 compared to $5,450 awarded to all other ethnic groups • California Latinos are less likely to receive federal aid than Latinos from other states. Less than 1/3 of Latinos in California receive federal aid to pay for college. Nationally, 50% of Latinos received federal aid
Degree Attainment • California ranks 46th among the 50 states in college age population earning a bachelor’s degree • California ranks LAST among the 50 states in the percentage of Latinos and African Americans earning bachelor’s degrees • The percentage of the workforce with a college degree is projected to decline by 2020
Workforce Needs & Benefits • Today, 1 in 4 jobs in California requires an associate degree or higher, but in the near future 1 new job in 3 will require this level of education • Three million new highly educated workers will be needed in the near future due to retirement and demand • The income of California residents is projected to decline over the next 20 years unless the state can increase the number of Latinos earning college degrees • For every dollar invested to increase the number of students attending college and completing degrees, California gets $3 in net return
Conclusions • Major factors that negatively impact our ability to assure our diverse future workforce: • Demographics • Location of schools • Outreach • Cost of education • Outreach – financial aid • Major advantages of partnerships/coalitions to support the pipeline: • Schools • Expertise • Outreach – pipeline • Business • Funding/investment • Expertise/talent
CONCLUSION THE ROLE OF THE BUSINESS & PROFESSIONAL COMMUNITIES
Workforce Issues • “Only 33 percent of the state’s working-age adults were projected to have a college degree in 2020, but 39 percent of jobs in the state’s economy were projected to need a college graduate worker”. California Counts Can California Import Enough College Graduates to Meet Workforce Needs?
Economic Issues Average Income by Educational Attainment Alliance for Excellent Ed 14th Ed Law Conference 2007
Economic Issues • Benefit to State of California for each high school graduate estimated to be $53,000-$392,000 • Loss per cohort of 120 20 year olds who don’t complete high school to state of CA > $46 Billion California Dropout Research Project PB 2
Overview Education Opportunity “The results of these analyses are sobering: California students face significant roadblocks on their pathway to college. These roadblocks help explain why California sends fewer students to four-year colleges than most other states in the country. “ CALIFORNIA EDUCATIONAL OPPORTUNITY 2006
California Overview Lack of Opportunity COUNSELORS TEACHERS w/ ADEQUATE TRAINING, COLLEGE PREPARATORY CURRICULUM • “responsible for more students than ..in any other state.” • “responsible for more students than …in any other state” • “more than ¼ CA high schools routinely assign improperly trained teachers to college prep courses” • ”More than ½ CA high schools offer too few college preparatory classes for =all students to complete the college preparatory curriculum.” CALIFORNIA EDUCATIONAL OPPORTUNITY 2006
The roadblocks to college loom larger for students living in low-income communities of color. Every California community feels the effect of the state’s educational crisis, but all communities don’t suffer equally. Schools with high concentrations of students of color, many of whom are poor and learning the English language, report the highest rates of unqualified teachers and shortages of college preparatory courses in the state. These students are not given a fair and equal opportunity to learn. THE LEAKING PIPELINE
e.g. , The Law Community • Collaborative partners • Well before the law school gates • The new 3Rs “Our partnerships allow us to say to our students: ‘You can do it. See, there are lots of important people who care about you and believe in you.’ Principal, Elana Karopkin, School of Law and Justice in Brooklyn, NY, whose partners include Cravath, Swaine & Moore and Brooklyn Law School. The school motto is “…Knowledge of the law is power in the world.”
FMI Sarah Redfield sarah.redfield@gmail.com 207-752-1721 www.edlaw.org
State Bar of California Diversity Pipeline Project Average 2005 LSAT admit +1 = Asian & White 157= average LSAT admit 05 -3 = Chicano & Hispanic -4 = Am Indian Alaskan Native -5 = Canadian Aboriginal -7 = African American -12 = Puerto Rican