Download
1 / 14
140 likes | 291 Vues
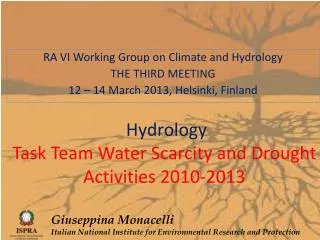
Hydrology Task Team Water Scarcity and Drought Activities 2010-2013. RA VI Working Group on Climate and Hydrology THE THIRD MEETING 12 – 14 March 2013, Helsinki, Finland. Giuseppina Monacelli Italian National Institute for Environmental Research and Protection.

E N D
Hydrology Task Team Water Scarcity and DroughtActivities 2010-2013 RA VI Working Group on Climate and Hydrology THE THIRD MEETING 12 – 14 March 2013, Helsinki, Finland Giuseppina Monacelli Italian National InstituteforEnvironmentalResearch and Protection
TT- WSD work plan2010-13 • State of the art review of WS&D observatories • Review of existing observatories • Assessment of WSD index and indicators, databases and mapping tools • Design of a regional meteorological and hydrological drought forecasting system (for the development of a drought risk management strategy at regional, basin and local level) • -Review of existing studies, experiences and tools • -Regional strategy for drought risk management • -Identification of mitigation measures • -WDS workshop • Analyses of drought impacts in river flow and ecology (e-flow) • -Review of existing methodologies • -Analyses and application of methodologies in pilot tests • Improved WMO RA VI level coordination (with focus on WMO and EU) • -Facilitate links and circulation of documentation • -Coordinated organization of WSD meeting and event • -Report of coordinated activities • Integration of drought related activities within WG CH • -Joint summary report of TT-WSD and TT-DM Task Team Water Scarcity and Drought-Activities 2010-2013- Giuseppina Monacelli , ISPRA Italy RA VI_WGCH3/ Hydrology - 12 – 14 March 2013, Helsinki, Finland
State of the art review of WS&D observatoriesReview of existing observatoriesAssessment of WSD index and indicators, databases and mapping tools Presentationof EDO JuergenVogt, JRC Ispra VeniceWS&D EG meeting ,13-14 October 2011 Task Team Water Scarcity and Drought-Activities 2010-2013- Giuseppina Monacelli , ISPRA Italy RA VI_WGCH3/ Hydrology - 12 – 14 March 2013, Helsinki, Finland
State of the art review of WS&D observatoriesReview of existing observatoriesAssessment of WSD index and indicators, databases and mapping tools Presentationof EDO, JuergenVogt, JRC Ispra VeniceWS&D EG meeting ,13-14 October 2011 Task Team Water Scarcity and Drought-Activities 2010-2013- Giuseppina Monacelli , ISPRA Italy RA VI_WGCH3/ Hydrology - 12 – 14 March 2013, Helsinki, Finland
State of the art review of WS&D observatoriesReview of existing observatoriesAssessment of WSD index and indicators, databases and mapping tools • Existing and new WS&D observatories are developing in close coordination with the EDO • and, after the Venice workshop (Sept 2011), a lot of new experts belonging to the NMHS • entered in the CIS WS&D EG. The last 2012 EG meeting was hosted in Bratislava by the SHMU and also a Turkish colleague participated. During this meeting the CarpatClim project was presentedand it was highlighted that the database and the procedures for drought indicators – SPI indicator in particular – were developed in compliance with EDO fulfilment. • So a Central Europe Drought Monitoring Centre is close to be added to the previous implemented ones and will be the second, after DMCSEE, to be supported by WMO. • Three indicators were agreed so far by EU Water Directors and they can extensively be calculated on the basis of pan-European information: • The Standardized Precipitation Index (SPI) -> EDO • The fraction of Absorbed Photosynthetically Active Solar Radiation (fAPAR) -> EDO • The Water Exploitation Index Plus (WEI+) -> EEA Task Team Water Scarcity and Drought-Activities 2010-2013- Giuseppina Monacelli , ISPRA Italy RA VI_WGCH3/ Hydrology - 12 – 14 March 2013, Helsinki, Finland
State of the art review of WS&D observatoriesReview of existing observatoriesAssessment of WSD index and indicators, databases and mapping tools • CIS WS&D Expert Group _”Water Scarcity and Drought indicator set development” doc • The Standardized Precipitation Index (SPI) is an indicator to detect and quantify meteorological drought situations by comparing the current situation to historical records. This indicator can produce different time-related outputs, so meteorological drought evidence and evolution can be shown for the past month(s), season(s) and/or year(s), facilitating the establishment of links to other drought indicators. In 2010 WMO selected the SPI as a key meteorological drought indicator to be produced operationally by meteorological services • The selected Vegetation Response indicator is the fraction of Absorbed Photosynthetically Active Solar Radiation (fAPAR). It represents the fraction of the solar energy which is absorbed by the vegetation canopy and is a biophysical variable directly correlated with the primary productivity of the vegetation. Its anomalies (the deviation from the long-term mean for a certain period of time) are considered a good indicator to detect and assess drought impacts on vegetation canopies. • The Water Exploitation Index Plus(WEI+) of a particular area is the total consumption of water divided by the renewable freshwater resources in a given period. It provides an indication of the withstand pressure on the water resources of a certain territory as a consequence of water withdrawals. Hence, it also identifies those most prone areas to suffer recurrent or permanent situations of water scarcity • A number of further indicators have been agreed by the Expert Group but not so far endorsed by the WDs : Snowpack, Standardised Run-off Index (SRI), Groundwater and Soil Moisture.The SRI, Groundwater and Soil Moisture indicators are also influenced by water uses, and hence not pure drought indicators Task Team Water Scarcity and Drought-Activities 2010-2013- Giuseppina Monacelli , ISPRA Italy RA VI_WGCH3/ Hydrology - 12 – 14 March 2013, Helsinki, Finland
State of the art review of WS&D observatoriesReview of existing observatoriesAssessment of WSD index and indicators, databases and mapping tools CIS WS&D Expert Group _”Water Scarcity and Drought indicator set development” doc Reference period for calculating the Statistics (from SPI factsheet) The World Meteorological Organization (WMO) recommends that precipitation totals for the at least 30 years are used as reference time-line for calculating rainfall statistics. Several investigators recommend calculating the statistics for the SPI from even longer time periods (e.g., 50 or more years) in order to ensure an accurate representation of extreme events. The current WMO standard reference period is 1961-1990. However several Member States use more recent periods (e.g., 1971-2000, 1981-2010) in order to accommodate changes in the precipitation regime due to climate change and to compare actual rainfall figures to a more recent situation. In order to ensure comparability of the results across Europe and across scales it is highly recommended to use a common reference period for the calculation of the SPI. Considering the results of an inventory of the reference periods used in various Member States, the specific needs for accurately representing extreme events, and possible changes in the rainfall regimes due to climate change, the Water Scarcity and Drought Expert Group strongly recommends using the period January 1971 to December 2010 as Reference Period for the calculation of the SPI. Task Team Water Scarcity and Drought-Activities 2010-2013- Giuseppina Monacelli , ISPRA Italy RA VI_WGCH3/ Hydrology - 12 – 14 March 2013, Helsinki, Finland
State of the art review of WS&D observatoriesReview of existing observatoriesAssessment of WSD index and indicators, databases and mapping tools • Mapping tools: • Inside WS&D EG a document was produced by the Spanish team “Drought Hazard and Water Scarcity Risk Maps – Bases for discussion” establishing the main goals: • To visualise and communicate the probability of occurrence of drought. • To depict potential adverse consequences of drought. • To help identifying types of measures at a local (when possible), basin, national and European scale to mitigate the impacts of a drought. • To generate usable maps that can be used by water managers, stakeholders and public to discuss/identify measures for a sustainable water management. • Australian Government: “The Bureau's seasonal outlooks are general statements about the probability or risk of wetter or drier than average weather over a three-month period”. Also the Bureau establishes that “These outlooks should be used as a tool in risk management and decision making”. • Bureau of Meteorology (2012): A wetter season more likely for much of northern and central Australia. • Available at: http://www.bom.gov.au/climate/ahead/rain_ahead.shtml Task Team Water Scarcity and Drought-Activities 2010-2013- Giuseppina Monacelli , ISPRA Italy RA VI_WGCH3/ Hydrology - 12 – 14 March 2013, Helsinki, Finland
State of the art review of WS&D observatoriesReview of existing observatoriesAssessment of WSD index and indicators, databases and mapping tools Mapping tools: • ClimWatAdapt and SCENES projects: For this project maps of future water use, under the climate change scenarios, have been developed. The maps mirror the different possibilities on how the European water resources may unfold in the future. It can be seen that the profile of water uses will change in the future depending on the scenario (http://www.climwatadapt.eu/scenarios). Task Team Water Scarcity and Drought-Activities 2010-2013- Giuseppina Monacelli , ISPRA Italy RA VI_WGCH3/ Hydrology - 12 – 14 March 2013, Helsinki, Finland
Design of a regional meteorological and hydrological • drought forecasting system (for the development of a • drought risk management strategy at • regional, basin and local level) The theme of drought forecasting was discussed again in the context of WS&D EN of the WFD-CIS and related to the EDO implementation. JRC was in 2012 further developing the web page of the observatory and the correlated tools, improving the portal with new functionalities. A combined D indicator (CDI), targeted to “agricultural D” is based on SPI anomalies (“watch level”, different SPIs) and if soil moisture data show similar trends, “warning” can be established, and fAPAR can help identifying “alert” levels. This development is still beeing tested out. Current development has been done in the field of introducing a “memory effect” that e.g. helps to inform/consider previous spring-Ds in summer evaluations. Could be also raised the possibility of including water stress indicator, thresholds, etc. in order to consider the possibility of forecasting Task Team Water Scarcity and Drought-Activities 2010-2013- Giuseppina Monacelli , ISPRA Italy RA VI_WGCH3/ Hydrology - 12 – 14 March 2013, Helsinki, Finland
Analyses of drought impacts in river flow and ecology (e-flow) E-flow was discussed on the basis of preliminary studies and will be further developed during 2013. The text of the study “Environmental flows as a tool to achieve the WFD objectives discussion paper” produced by COM-Consultants was disseminated to receive comments within WMO organization. Further development are envisaged also related to other themes like hydro-morphology, ecosystem services, and sediments with a similar vision and perception of the concepts. For what concerns the methods, there is no model which can fit every situation , but a combination of methods is required; and the paper has a specific section regarding the implementation of methods trough a hierarchical approach. A document of Costa-Rica power production on e-flow has also been circulating to compare the approaches. The issue is sensitive for users, but also comparing with hydrological situation in some RBs. The necessity of a clear scientific methodological approach rose during several meetings considering relevant the use of different models in relation with different natural reference conditions. Task Team Water Scarcity and Drought-Activities 2010-2013- Giuseppina Monacelli , ISPRA Italy RA VI_WGCH3/ Hydrology - 12 – 14 March 2013, Helsinki, Finland
Improved WMO RA VI level coordination (focus on WMO and EU) The contemporaneous coordination of this TT and the EU WFD-CIS WS&D EN is facilitating the implementation of the programme due to the easy sharing of information and methodological approaches among EU and non-EU countries belonging to the Region. The close collaboration between JRC, that manage EDO, and the national entities is creating a strong opportunity for NHMSs to develop at national and at macro-region level observing and forecasting systems covering the entire WMO Reg VI. Venice meeting was the occasionfor a joint WSD and DM TTsdiscussionsession Task Team Water Scarcity and Drought-Activities 2010-2013- Giuseppina Monacelli , ISPRA Italy RA VI_WGCH3/ Hydrology - 12 – 14 March 2013, Helsinki, Finland
Integration of drought related activities within WG CH -Joint summary report of TT-WSD and TT-DM Task Team Water Scarcity and Drought-Activities 2010-2013- Giuseppina Monacelli , ISPRA Italy RA VI_WGCH3/ Hydrology - 12 – 14 March 2013, Helsinki, Finland
Thankyou Task Team Water Scarcity and Drought-Activities 2010-2013- Giuseppina Monacelli , ISPRA Italy RA VI_WGCH3/ Hydrology - 12 – 14 March 2013, Helsinki, Finland