What do maps show us?
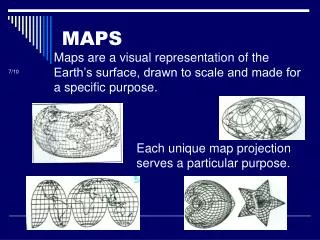
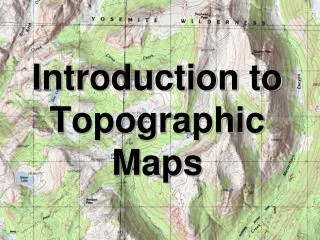
What do maps show us?. What can we not see on flat, two-dimensional maps?. Topographic Maps. Topographic Maps. A topographic map is used to show the __________________of an area. elevation. Contour Lines. A contour line connects points of ____________elevation on a field map. equal. 0.

What do maps show us?
E N D
Presentation Transcript
What do maps show us? What can we not see on flat, two-dimensional maps?
Topographic Maps A topographic map is used to show the __________________of an area elevation
Contour Lines A contour line connects points of ____________elevation on a field map equal
0 10 40 20 30
Contour Lines are Continuous They never end!
Contour Lines can NEVER CROSS Contour lines are _______________ parallel
Topographic Profile side A topographic profile is a _________ view of a landscape
Cross sectional view of a line drawn through a topographic map
Topographic Profile Contour line (side view) (top view)
Contour Interval difference A contour interval is the ______________in _______________ between consecutive contour lines elevation What is the contour interval for this map?
Contour Interval The highest elevation can be found within the highest _____________________ contour line What is a possible elevation for this point?
Slopes The distance between contour lines indicate the ________________ of the slope steepness Steep Closer together = steeper slope Farther apart = gentler slope Gentle
Depressions decreases A depression is an area on land that ___________ Depressions are represented by hachured contour lines Hachured Lines
Depressions first • The __________hachured line is equal to the last regular contour line. • The ____________hachured line goes ___________by one contour interval. second down 60 m 50 m
Benchmark A benchmark is a position where the ___________ elevation has been measured exact 82
Streams “V” Contour lines form a ________ shape that point upstream
Sea Level land water Where the ____________ meets the ____________ - has an elevation of zero
Sea Level ocean
0 Contour Map 10 20 30 40 A B 43 43 40 30 Profile 20 10 A’ B’ 0