Download
1 / 54
540 likes | 786 Vues
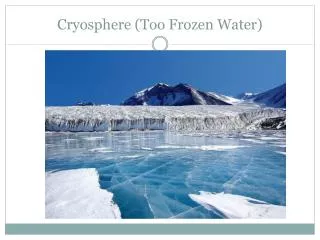
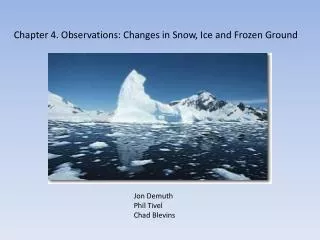
Chapter 4. Observations: Changes in Snow, Ice and Frozen Ground. Jon Demuth Phil Tivel Chad Blevins. Background. Cryosphere Consists of: snow, river and lake ice, sea ice glaciers and ice caps, ice shelves and ice sheets, frozen ground 2 nd largest component of the climate system

E N D
Chapter 4. Observations: Changes in Snow, Ice and Frozen Ground Jon Demuth Phil Tivel Chad Blevins
Background • Cryosphere • Consists of: snow, river and lake ice, sea ice glaciers and ice caps, ice shelves and ice sheets, frozen ground • 2nd largest component of the climate system • Linked to energy budget • Natural sensor of climate variability • important climate change variable
Chapter Summary • Snow decrease • Later formation of lake/river ice • Earlier melt of lake/river ice • Sea ice extent decrease • Loss of Glacier and Ice Caps • Sea level rise • Permafrost loss
Snow cover in NH dropped 5 %, in SH records indicate decrease or no changes (1966-2005) Northern Hemisphere snow-covered area anomalies: This shows Northern Hemisphere snow-covered area departures from monthly means, 1978-2005, from NOAA snow charts (orange) and microwave satellite (purple/green) data sets. The NOAA time series for this period exhibits a significant decreasing trend of -2.0 percent per decade (solid orange line); the microwave snow cover time series exhibits a decreasing trend of -0.7 percent per decade that is not significant at a 90 percent level (dashed green line). The National Snow and Ice Data Center Supporting Cryospheric Research Since 1976449 UCB University of Colorado Boulder, CO 80309-0449
Satellite data show continuing decline in mean arctic sea ice extent since 1978 Extent comparisons: This graph compares 5-day running means for Arctic sea ice extent (area of ocean with ice concentration of at least 15 percent) for the long-term mean (1979-2000), the previous record low (2005) and the record low (2007). Although the summer of 2007 began with slightly greater ice extent than in 2005, rapid melting commenced in late June. During a two-week period in late June and early July 2007, sea ice declined by an area roughly equal to the size of Kansas each day. Sea ice extent continued its steady decline through mid-September, 2007. Image provided by National Snow and Ice Data Center, University of Colorado, Boulder. The National Snow and Ice Data Center Supporting Cryospheric Research Since 1976449 UCB University of Colorado Boulder, CO 80309-0449
The National Snow and Ice Data Center Supporting Cryospheric Research Since 1976449 UCB University of Colorado Boulder, CO 80309-0449
Northwest Passage: The maroon line marks the route of the Northwest Passage that opened up in 2007. http://www.nasa.gov/centers/goddard/mpg/143497main_sea_ice2005_composite_320x240.mpg The National Snow and Ice Data Center Supporting Cryospheric Research Since 1976449 UCB University of Colorado Boulder, CO 80309-0449
Mass loss of glaciers and ice caps Glacier mass balance: Image courtesy of Mark Dyurgerov, Institute of Arctic and Alpine Research, University of Colorado, Boulder. The National Snow and Ice Data Center Supporting Cryospheric Research Since 1976449 UCB University of Colorado Boulder, CO 80309-0449
1941-2004 comparison: Glacier Bay National Park and Reserve's White Thunder Ridge as seen on August 13, 1941 (left) and August 31, 2004 (right). Muir Glacier has retreated out of the field of view, Riggs Glacier has thinned and retreated significantly, and dense new vegetation has appeared. Muir Glacier was more than 2,000 feet thick in 1941. 2004 USGS photo by B. F. Molnia; 1941 photo by W. O. Field. See the Repeat Photography of Glaciers Special Collection in the Glacier Photograph Collection to access this and other photograph pairs. 1928-2000 comparison: These photos of the South Cascade Glacier in the Washington Cascade Mountains show dramatic retreat between 1928 and 2000. Photos courtesy of the USGS. The National Snow and Ice Data Center Supporting Cryospheric Research Since 1976449 UCB University of Colorado Boulder, CO 80309-0449
Ice sheets have very likely contributed to sea level rise Small glacier/ice cap contribution: The cumulative contribution to sea level from small glaciers and ice caps (red) plotted with the annual global surface air temperature anomaly (blue) . Sea level rise contributors: Comparison of volume (white), area (grey) and percent contribution to sea level rise (red) by small glaciers and ice caps, and the Greenland and Antarctic Ice Sheets. The National Snow and Ice Data Center Supporting Cryospheric Research Since 1976449 UCB University of Colorado Boulder, CO 80309-0449
Permafrost temperature has increased Coastal erosion: Intact permafrost is extremely strong and resistant to erosion, and intact sea ice minimizes wave action in the ocean. When sea ice retreats and permafrost degrades, coastlines become much more vulnerable to erosion. These pictures were taken in Shishmaref, Alaska, during a storm in 2003. Only two hours separate the first photo from the second. For reference, red arrows mark the barrel. By the time the second photograph was taken, the coastline in the foreground had retreated past the barrel. Although coastal erosion was significant, this was not a particularly strong storm. Maximum extent of frozen ground has decreased The National Snow and Ice Data Center Supporting Cryospheric Research Since 1976449 UCB University of Colorado Boulder, CO 80309-0449
4.1 Introduction Physical Properties: -surface reflectivity and latent heat -presence or absence of snow or ice Cryosphere on land = 75% of worlds freshwater (7m and 57m rise) Currently Ice covers 10% of land and 7% of oceans All parts contribute to short term climate Changes in glaciers and ice caps reflect climate variations Permafrost accounts for 24% of land in NH
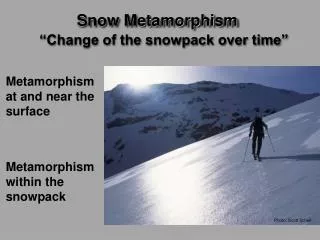
4.2 Changes in Snow Cover • High albedo of snow very important on surface energy • Decreasing because of soot • Snow cover data collected since 1966 – longest env. Data set of any kind • SCA has declined in spring and summer but not a lot in winter • Spring melt 2 weeks early • Significant decline in mean SCA • temp variations play significant role in trends of SCA • N. America SCA increased in Nov, Dec and Jan (1915-2004) • Eurasia SCA in mountains show recent decline and lower elevations • S. America show great interannual variablitly but little or no long –term trend • S. East Australia significant snow depth declines
4.2 Changes in Snow Cover IPCC 2007 IPCC 2007
4.2 Changes in Snow Cover IPCC 2007
4.2 Changes in Snow Cover Frei, A. and G. Gong, 2005. Decadal to Century Scale Trends in North American Snow Extent in Coupled Atmosphere-Ocean General Circulation Models. Geophysical Research Letters, 32:L18502, doi: 10.1029/2005GL023394.
4.3 Changes in River and Lake Ice IPCC 2007 Freeze-up and breakup dates for river and lake ice show spatial variability – later and earlier
4.3 Changes in River Ice IPCC 2007
4.3 Changes in Lake Ice IPCC 2007
Importance of Sea Ice • Provides Albedo effect • Modifies the exchange of heat, gasses and momentum between the atmosphere and polar oceans • Redistributes freshwater via the transport and subsequent melt of relatively fresh sea ice. • Insulates ocean from cold atmosphere • Arctic mammals (seals, polar bears) hunt, breed, and feed on the ice
Climatically important Characteristics of sea ice • Its concentration (fraction of ocean covered by it) • Its extent (area enclosed by the ice edge) • Total area of ice in it’s extent (extent weighted by concentration) • The area of multi-year ice within total extent • Its thickness • Velocity • Growth and melt rates (affects freshwater flux in ocean)
Measurements • Ice extent, or ice edge position is the only sea ice variable for which observations are available for more than a few decades. • Expansion or retreat of ice may be amplified by albedo effect.
Methods of Measuring Sea Ice Extent • Passive microwave data from satellites are accurate to 95% but errors of 10% to 20% can be seen during the melt season. • An algorithm converts the observed radiance to ice concentration. • It is difficult to distinguish between first year and multiyear ice, but algorithms are improving upon this. • Aircraft, Ship (19th century) and Coastal observations have also been made with regards to sea ice extent, but data is regional and mainly in the Northern Hemisphere.
Nov 1978 – Dec 2005 annual mean ice extent anomalies. IPCC 2007
Ice Thickness USS Skate 1959 surfacing - http://www.csp.navy.mil/asl/ScrapBook/Boats/Skate1959.jpg USS Hawkbill photo, 1999 - http://www.usshawkbill.com/scicex3.jpg
The sea ice outflow through the Fram Strait is a major component of the ice mass balance in the Arctic IPCC 2007
Changes in Glaciers and Ice Caps Southern Patagonia Ice Cap Baffin Island Glacier, Canada Tidewater Glacier
Extents of Glaciers and Ice Caps Earths Ice Mass 90% - Antarctica 10% - Greenland <1% - Other *USGS* NSIDC - National Snow and Ice Data Center
Retreat of Glacial Tongues Mass balance data is archived and distributed by the World Glacier Monitoring Service (WGMS) SH (tropics, New Zealand, Patagonia) NW North America (mainly Canadian Rockies) Atlantic (South Greenland, Iceland, Jan Mayen, Svalbard Scandinavia), European Alps and Asia (Caucasus and central Asia)
Global Averaged Mean Specific Mass Index a – 546X103KM2 b – 785X103 KM2 CELSIAS Co5a/i – Cogley, 2005 DM05 – Dyurgerov and Meier, 2005 O04 – Ohmura, 2004
Mean Specific Mass Balance vs. Sea Level Rise • Most Significant Climate Change • Patagonia • Alaska and Coast Mts • NW USA and SW Canada • Highest Contributor to Sea Level Rise • Alaska and Coast Mts • Arctic • Asian High Mts
Greenland • Inland is thickening and edges are thinning • Very noticeable at outlet glaciers • J represents the Jakobshavn glacier. – Fastest • Moving glacier in Greenland. More than doubled • in speed from 1997 – 2003 (3.5 mph to 7.8 mph) IPCC 2007
Thinning in the southwest Thickening in the northeast IPCC 2007
Ice Flow Acceleration • Acceleration in ice flow is important as the faster it is the more ice that moves from land into the ocean. • Jakobshavn drains 6.5% of Greenland’s ice sheet area. Acceleration doubling (1997 -2003) for this glacier is very significant. The acceleration of it has increased sea level rise by.06 millimeters per year. • Also, the rapid movement of ice from land into the sea provides key evidence of newly discovered relationships between ice sheets, sea level rise and climate warming. • The glacier's sudden speed-up also coincides with very rapid thinning of the glacier, indicating loss of ice of up to 15 meters (49 feet) in thickness per year after 1997. Along with increased rates of ice flow and thinning, the thick ice that extends from the mouth of the glacier into the ocean, called the ice tongue, began retreating in 2000, breaking up almost completely by May 2003.
Mass Balance estimates for Greenland IPCC 2007
Mass Balance estimates for grounded ice in Antarctica IPCC 2007
X Y • Assessment of data and techniques by IPCC suggest a mass balance for the • Greenland Ice Sheet ranging between • Growth of 25 Gt per year and Shrinkage of 60 Gt per year from 1961 to 2003. • Shrinkage of 50 and 100 Gt per year from 1993 to 2003 • Even higher rate from 2003 to present (derived from only a small amount of estimates and • there is a lack of agreement between techniques so data isn’t shown)
Antarctica InSAR measurements • Ice balance for east Antarctica ranges from possible growth of 41 Gt per year, • and possible loss of 1 Gt per year for the regions monitored. • Ice balance for west Antarctica ranges from loss of 31 to 57 Gt per year • for the region monitored. • For the regions monitored the combined Ice balance range for Antarctica would be • Between a growth of 1Gt per year and a loss of 49Gt per year • Time period for this is loosely constrained as input data was of varying length • and output data was determined primarily in the few years before 2002
Ice Sheets • Looking at all data and techniques, IPCC assesses Antarctic ice sheet mass balance ranges from a growth of 50Gt per year to shrinkage of 200 Gt per year from 1993 to 2003. • IPCC estimates that the mass balance of both ice sheets range from growth of 100 Gt per year and shrinkage of 200 GT per year from 1961 to 2003, but needs to assume accumulation rates, ice flow acceleration rates, and slow time scales affecting central regions of the ice sheets. • More recent estimates from 1993 to 2003 suggest mass balance ranging from a shrinkage of 0 Gt per year to 300 Gt per year.
Ice Sheets • Both Antarctica and Greenland ice caps have too few measurements, too many disagreements on measurement techniques, and the existence of systematic error that cannot be estimated accurately for the inclusion of confidence limits and formal error analysis.
Changes in Frozen Ground Thermokarst Lakes (a.k.a thaw lakes) Northern Hemisphere Frozen Ground Seasonally Frozen Ground Intermittently Frozen Ground
Recent Trends in Permafrost Temperature ***Permafrost Degradation*** ***Subsea Permafrost***
Changes in the Active Layer Blue Dots – Active layer monitoring stations Russia 1956 - 1990 Red Dots - Maximum soil freeze depth stations Active layer monitoring stations (Mackenzie Delta - 1998)