Download
1 / 14
170 likes | 416 Vues
Natural Resources. Natural Resources. Quality of Life Measuring the Quality of Life Natural Resources Conflicts Over Natural Resources Resource Profiles. Quality of Life.

E N D
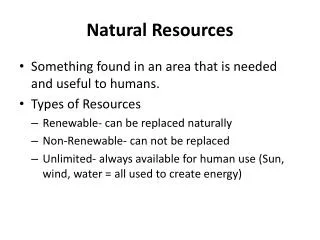
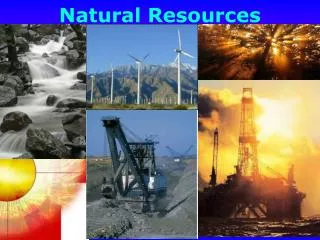
Natural Resources • Quality of Life • Measuring the Quality of Life • Natural Resources • Conflicts Over Natural Resources • Resource Profiles
Quality of Life • Quality of life is affected by two factors: the standard of living and the non-material things that people desire to improve the way they live. • Quality of life is affected by material standards of living (economics), but it also includes environmental, social, and political factors.
Measuring Quality of Life • The criteria one uses to measure “quality of life” will greatly affect the resulting ranks. • What should be considered to measure “quality of life”? • Health • Education • Demographics • Finance
Measuring Quality of Life • Human Development Index (HDI) is a comparative measure of life expectancy, literacy, education, and standards of living for countries worldwide • developed in 1990 by Pakistani economist Mahbub ul Haq • adopted by the UNDP in 1993
Measuring Quality of Life • Human Development Index looks at 3 factors to to calculate the final H.D.I. figure: • Life expectancy at birth • Knowledge (adult literacy rate, gross enrolment ratio) • Gross Domestic Product per capita at Purchasing Power Parity • Close to 1 = high quality of life • Close to 0 = low quality of life
Measuring Quality of Life • Human Development Report 2010 • VERY HIGH HUMAN DEVELOPMENT
Measuring Quality of Life • Human Development Report 2010 • LOW HUMAN DEVELOPMENT
Measuring Quality of Life • Human Development Index trends, 1980–2010
Measuring Quality of Life • An HDI of 0.8 or more is considered to represent high development. • all developed countries • some developing countries in Eastern Europe, Latin America, Southeast Asia, and the oil-rich Arabian Peninsula • An HDI below 0.5 is considered to represent low development • 29 of the 31 countries in that category are located in Africa, with the exceptions of Haiti and Yemen
Measuring Quality of Life • Canada worked its way up to the #1 spot on the HDI rankings on 10 different occasions (including 7 years in a row from 1994-2000) • Since then, we’ve dropped as low as #6 (and now #4) while Norway and now Iceland claim top honours 2000 – Canada 1999 – Canada 1998 – Canada 1997 – Canada 1996 – Canada 1995 – Canada 1994 – Canada 2007 – Iceland 2006 – Norway 2005 – Norway 2004 – Norway 2003 – Norway 2002 – Norway 2001 – Norway 1993 – Japan 1992 – Canada 1991 – Japan 1990 – Canada 1985 – Canada 1980 – Switzerland
Quality of Life • Quality of life concerns the standard of living and the non-material things. • A clean environment, human rights, political freedom, and freedom of opportunity are only a few examples of non-material elements of life that most people desire. • How do resource development, food, and water play key roles in determining quality of life?
Quality of Life “If we all lived like people do in Nigeria, we would have plenty of energy, the water wouldn’t be polluted, the air would be clean. We’d all be poor, but we would be able to sustain our population at much greater numbers than we do now. It’s the impact the population has on the planet that is worrisome, not the actual numbers.”