Download

1 / 68
700 likes | 901 Vues
Bioinformatic Analysis of Chromatin Genomic Data. Giulio Pavesi University of Milano giulio.pavesi@unimi.it. Epigenetics. Modern experimental techniques and technologies allow for the genome-wide study of different types of histone modifications, shedding light on the role of each one.

E N D
Bioinformatic Analysis of Chromatin Genomic Data Giulio Pavesi University of Milano giulio.pavesi@unimi.it
Epigenetics • Modern experimental techniques and technologies allow for the genome-wide study of different types of histone modifications, shedding light on the role of each one
“ChIP” • If we have the “right” antibody, we can extract (“immunoprecipitate”) from living cells the protein of interest bound to the DNA • And - we can try to identify which were the DNA regions bound by the protein • Can be done for transcription factors • But can be done also for histones - and separately for each modification
After ChIP Identification of the DNA fragment bound by the protein PCR Microarray Hybridization Sequencing
Many cells- many copies of the same region bound by the protein
ChIP-Chip • Use extracted DNA to hybridize an oligonucleotide microarray suitably design to cover genomic regions of interest (e.g. promoters) or whole genomes (“tiling” arrays)
ChIP-Seq Histone ChIP TF ChIP
So - if we found that a region has been sequenced many times, then we can suppose that it was bound by the protein, but…
Only a short fragment of the extracted DNA region can be sequenced, at either or both ends (“single” vs “paired end” sequencing) for no more than 35 (before) / 50 (now) / 75 (now) bps Thus, original regions have to be “reconstructed” …and, once again, bioinformaticians can be of help…
Phase one: read mapping • Each sequence read has to be assigned to its original position in the genome • A typical ChIP-Seq experiment produces from 6 (before) to 100 million (now) reads of 50-70 and more base pairs for each sequencing “lane” (Solexa/Illumina) • Research in read alignment algorithms is booming (who is going to be the next BLAST?) • Critical step for genome re-sequencing/haplotyping/genotyping, but which mapping tool/strategy is more advisable in ChIP-Seq?
Read Mapping “Typical” Output @12_10_2007_SequencingRun_3_1_119_647 (actual sequence) TTTGAATATATTGAGAAAATATGACCATTTTT +12_10_2007_SequencingRun_3_1_119_647 (“quality” scores) 40 40 40 40 40 40 40 40 40 40 40 40 40 40 40 40 40 40 40 40 40 40 40 40 40 39 27 40 40 4 27 40
Phase one • Reads mapping more than once (repetitive regions) can be discarded: • Never, use all matches everywhere • If they map more than a given maximum number of times • If they do not map uniquely in the best match • If they do not map uniquely with 0, 1, or 2 substitutions
Phase one: read mapping • Personal advice: use an “exhaustive” tool (i.e. no heuristics) like ELAND or Seqmap that guarantees to find all matches given a set of input parameters • Tools like Seqmap (which indexes the reads) are also suitable for standard hardware equipment • Discard all reads mapping ambiguously • Remember, however, that if 25% of the reads are uniquely mapped the experiment can be considered a success, and if you get 50% that’s almost perfect!
Phase one: read mapping • Sequence quality tends to be lower toward the 3’end of sequence reads • Trick: if too few read map, “trim” the reads: • Map reads with standard parameters (two substitutions will do) • Take all the reads that haven’t been mapped, and re-map them trimming away the first and the last nucleotides • Repeat until no significant improvement/increase in mapped reads is obtained • Discard reads mapping on different locations of the genome
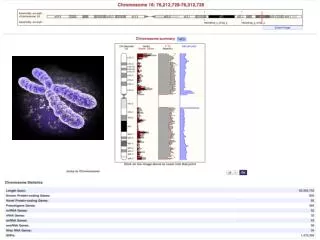
“Peak finding” • The critical part of any ChIP-Seq analysis is the identification of the genomic regions that produced a significantly high number of sequence reads • Since a graphical visualization of the “piling” of read mapping on the genome produces a “peak” in correspondence of these regions, the problem is often referred to as “peak finding” • A “peak” then marks the region that was enriched in the original DNA sample
“Peak finding”, in a perfect world Peaks: How tall? How wide? How much enriched?
“Peak finding” • The main issue: the DNA sample sequenced (apart from sequencing errors/artifacts) contains a lot of “noise” • Sample “contamination” - the DNA of the PhD student performing the experiment • DNA shearing is not uniform: open chromatin regions tend to be fragmented more easily and thus are more likely to be sequenced • Repetitive sequences might be artificially enriched due to inaccuracies in genome assembly • Amplification pushed too much: you see a single DNA fragment amplified, not enriched • As yet unknown problems, that anyway seem to produce “noisy” sequencings and screw the experiment up
Dealing with “noise” • A solution is to perform a “control” experiment, and use it to filter out the results: • “Input DNA”: a portion of the DNA sample removed before IP • “Mock IP DNA”: DNA obtained from IP without antibodies • “Non-specific IP DNA”: DNA obtained from IP using an antibody against a protein not known to be involved in DNA binding, e.g. immunoglobulin G • “Knock out IP DNA”: perform IP as in the main experiment, but on “knock out” cells that do not express the TF studied (cannot be done for histones…)
One sample vs. two sample • Peak finding strategies thus differ first of all on whether a control experiment is available or not • Performing a control experiment is advisable, but it is costly since it also requires a large amount of sequencing (it tends to produce reads spread all over the genome) • With or without control, several “peak finding” methods have been introduced, almost with a 1:1 ratio with respect to published studies
12 different methods have been introduced in less than 2 years - each one answers the questions in a different way and computes significance (p or q values) with different strategies..
“Peak calling” algorithms • In one-sample experiments, the rationale is usually the same: • Count how many reads fall within a given genomic region of “typical” size • Compute the probability of having the same number by chance w.r.t. some background model or w.r.t. the control experiment, and hence false discovery rates • Optional: look if reads are “balanced” on both strands • Basically, “the more, the better”: the problem is to define the “random model” to single out peaks that are “significantly tall”
“Peak calling” algorithms • In two-sample experiments, the rationale is usually the same: • Count how many reads fall within a given genomic region of “typical” size in the experiment • Count how many reads fall within a given genomic region of “typical” size in the control • Use the control count as “background expected value”, and compute an enrichment ratio in a SAGE or microarray fashion
Randomness: example • In the simplest form, we can assume that each genomic position has the same probability of producing a sequence read (uniform background) • Thus, the probability of finding by chance t reads of the experiment within a genomic region of size w taken from a genome of sizescan be computed with a binomial or a Poisson distribution • False discovery rates (FDR) can be thus computed
Randomness: example • k is the number of reads found in the window (or, the height of the peak) • Given g, the size of the genome • Given t, the total number of reads • Given w, the window size • (t/g)*w is the expected number of reads in a window of size w
Randomness: examples • The uniform model is a very rough approximation • “Local” parameters for binomial and Poisson distributions can be estimated, to account for the varying likelihood different genomic regions have in producing reads • A control experiment can be analyzed, in order to check whether it is actually uniformly-Poisson distributed
Zhang et. al. Modeling ChIP Sequencing In Silico with Applications Aug 22;4(8):e1000158.
Multiple hypothesis testing • Whatever the method used to assess the probability of a peak of being random or not (p-value) we have to remember that the same “test” yielding the p-value is repeated on every position of the genome • Thus, what we evaluate is not p-values associated to peaks, but rather “false discovery rates” (FDR’s) • FDR represent the fraction of the “positives” (the peaks predicted) that can be considered “false positives” at the significance level chosen
Further considerations in peak finding • Since a DNA region is sequenced at either end, a “real” region should contain a significant number of reads, but also these reads: • Should be mapped on both ends (but - one of the two ends could fall within a repetitive region) • Should be separated by a distance of “feasible size” (e.g. 200 bps)- depending on the size selection step before sequencing • All these considerations can be incorporated in peak finding algorithms
TF Bind DNA with different affinity Thus, the TF can be found bound to the DNA only in a fraction of the cell Can be “pulled down” also when acting as a co-factor Different competing sites close together Different TFs competing for the same sites Bottom line: HARD to predict every TF binding site in a 100% reliable way Histones A yes/no decision: a given histone of a given nucleosome has the modification or not The same modification tends to be present in most of the cells of the sample Different “competing” modifications can be assessed by performing different experiments and comparing the results Bottom line: somewhat EASIER - at least to have a global picture of the modification and its effect Transcription factors vs histone modifications
Histone modifications tend to be located at preferred locations with respect to gene annotations/transcribed regions Hence, enrichment can be assessed in two ways Enrichment with respect to the control experiment “Local” enrichment in given regions with respect to gene annotations Promoters (active/non active) Upstream of transcribed/non transcribed genes Within transcribed/not transcribed regions Enhancers, whatever else The control experiment should not show the same local “bias” ChIP-Seq histone data
Did I have enough data? • Once the mapping --> peak finding step is completed, one logical question is whether or not the experiment produced enough data to obtain meaningful results • Idea: • Remove a subset of the input reads • Determine how many peaks of the complete experiment could be retrieved also in the “incomplete” data sets • Is there a “saturation point”, that is, a percentage of the input reads that is enough to recover the full experiment?
One sample (no control) Two sample (with control)
Genome wide histone modifications maps through ChIP-Seq • Barski et.al - Cell 129 823-837, 2007 • 20 histone lysine and arginine methylations in CD4+ T cells • H3K27 • H3K9 • H3K36 • H3K79 • H3R2 • H4K20 • H4R3 • H2BK5 • Plus: • Pol II binding • H2A.Z (replaces H2A in some nucleosomes) • insulator-binding protein (CTCF)
Histone modifications at TSS Read count (peak height) -1000 0 +1000 Distance from TSS
Barski et. al. High-Resolution Profiling of Histone Methylations in the Human Genome, Cell 129(4)
Histone modifications at transcribed regions Read count (peak height) High Low Expression level