Download
1 / 1
20 likes | 231 Vues
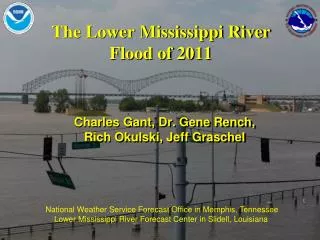
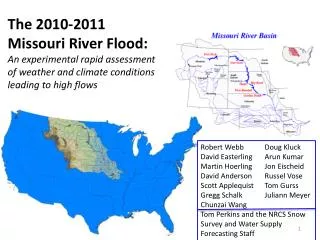
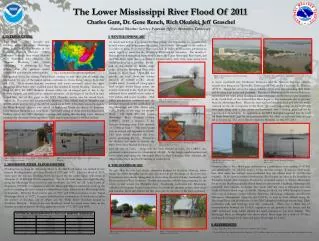
The Lower Mississippi River Flood Of 2011. Charles Gant, Dr. Gene Rench , Rich Okulski , Jeff Graschel. National Weather Service Forecast Office: Memphis, Tennessee. 1. INTRODUCTION. 3. WINTER/SPRING 2011.

E N D
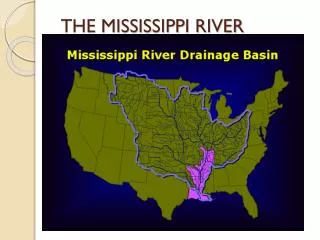
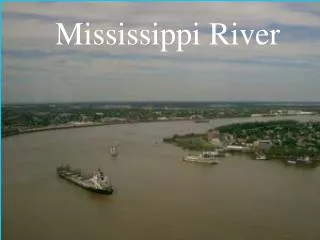
The Lower Mississippi River Flood Of 2011 Charles Gant, Dr. Gene Rench, Rich Okulski, Jeff Graschel National Weather Service Forecast Office: Memphis, Tennessee 1. INTRODUCTION 3. WINTER/SPRING 2011 The spring of 2011 brought epic flooding across the lower Mississippi River basin, and all tributaries in the National Weather Service (NWS) Memphis coverage area which includes West Tennessee, East Arkansas, the Missouri Bootheel, and North Mississippi. A continuing La Nina pattern from the previous winter contributed to a series of storm systems As mentioned before, a persistent La Nina pattern was responsible for a wetter than normal winter and spring across the central United States. Snowpack on the order of 12 inches in Iowa, 25 inches in Minnesota, and 20 inches in Wisconsin, produced an ample supply of water for the Mississippi River and its tributaries. The month of March produced widespread heavy rainfall across the Upper Mississippi River basin, and the Ohio River basin due to a stalled frontal boundary, with some areas seeing local rainfall totals of up to 10 inches. By the end of the month of March, many points along the Mississippi River were already in flood stage. April did not provide any relief from the intense amounts of rainfall to the already swollen rivers. A series of strong upper level troughs would sweep across the country from mid to late April providing additional heavy rainfall on the order of 5-10 inches, and severe weather. This added precipitation combined with the arriving snowmelt at the confluence of the Mississippi and Ohio Rivers near Cairo, Illinois, set the stage for an epic flood. On April 20th, the Lower Mississippi River Forecast Center (LMRFC) issued a tentative 5 day forecast indicating river levels upwards of 57.00ft at Cairo. This crest would later be revised and upgraded to 63.00ft. This level would threaten the levee system protecting the city. Therefore, the decision was made to activate the Birds Point/New Madrid Floodway to Fig. 1. Total Rainfall Accumulation thru April 29, 2011. that pushed across the central United States starting in mid-April, one of which was responsible for one of the largest tornado outbreaks in Unites States history, April 26th and 27th. These storms systems, combined with winter snowmelt across the upper Mississippi River basin, were a unified force that resulted in record flooding. During the flood of 2011, the NWS Memphis forecast office was an integral part of day to day decision support, and public safety oriented operations. At the height of the flood in early to mid-May, two of five gages in the NWS Memphis service area hit record levels, Tiptonville, Tennessee and Caruthersville, Missouri. The official crest at Memphis was 48.03ft, which was just shy of the 48.70ft record set in 1937. Elsewhere across the region, the White River in Arkansas rose out of its banks and forced the closure of Interstate Forty between Memphis and Little Rock. There were a total of three river flooding related fatalities across the NWS Memphis coverage area during this flooding event. Damage estimates for the entire Mississippi River Valley region were around 2-4 Billion dollars. Fig. 8. Goldstrike Casino in Tunica, Mississippi. May 11th, 2011 Fig 9. Fitz Casino in Tunica, Mississippi. May 11th, 2011. to move southward into Northwest Tennessee and the Missouri Bootheel, all-time records were being set at Tiptonville, Tennessee (48.35ft), and at Caruthersville, Missouri (47.61ft). Meanwhile across the region, tributary rivers were also exceeding their banks and flooding local towns and farmland. The city of Dyersburg in Northwest Tennessee experienced the worst urban flooding as some 600 homes and businesses were inundated as the North Fork of the Forked Deer River began to flow backwards due to pressure from the Mississippi River. When the crest reached Memphis, local and national media centered on the city in response to the flood. As waters kept rising, the local USACE river gage along with a few others malfunctioned, and a backup gage had to be implemented immediately. As a precaution, the NWS Memphis requested that the local old Beale Street Staff gage be read and reported to the office on an hourly basis to help aid in forecasting. The river officially crested at Memphis on May 10th, 2011. Fig. 4. Mississippi River backwater flooding in Dyer Co. Tennessee. March 9th, 2011 Fig. 5. Mississippi River backwater flooding in Dyer Co. Tennessee. March 22nd, 2011 save the city of Cairo. Along with the crest forecast at Cairo, the LMRFC also produced a crest forecast for Memphis of 48.00ft. At this height, much farmland and some urban areas along the Mississippi River in West Tennessee, East Arkansas, the Missouri Bootheel, and North Mississippi would flood. Fig. 2. Mississippi River Flooding of Riverside Drive, and Beale Street. Downtown Memphis. Fig. 3. Mississippi River Flooding of Mud Island. Downtown Memphis. Fig. 10. Beale Street Staff Gage . May 10th, 2011 Fig 11. Mud Island in Memphis, Tennessee. May 9th, 2011. 2. MISSISSIPPI RIVER FLOOD HISTORY 4. THE FLOOD OF 2011 However, due to the official gage malfunctions, a preliminary crest reading of 47.81ft was calculated by the USACE using a 10 day moving average. It was not until weeks later after water line surveys were conducted that the official crest of 48.03ft was released. As the crest continued downstream, flood waters ate away at the shoreline at Presidents Island, and eventually flooded the evacuated casinos in Tunica, Mississippi. Focus on the flood then quickly shifted further south towards Vicksburg, Mississippi and eventually New Orleans, Louisiana. Two weeks after the crest at Memphis, the river finally fell below flood stage of 34.00ft. During the flood, the NWS Memphis forecast office was in constant contact with the Tennessee, Mississippi, Arkansas, and Missouri Emergency Management Agencies, the USACE, as well as local officials along the Mississippi River and all tributaries in the NWS Memphis hydrologic service area. Daily conference calls and briefings were also conducted. There was a direct line of communication between the USACE engineers on the ground at the levees, and the NWS hydrologic team, which allowed for quick response to any levee failures. The Mississippi River at Memphis was above minor flood stage for a total of 30 days, moderate flood stage for 21 days, and major flood stage for 8 days. Flooding history along the Mississippi River in the Mid-South region was marked by two historic flooding events, the Great Floods of 1927 and 1937. Until the flood of 2011, these were the top two flooding events in history for the entire region with crests at Memphis of 45.80ft and 48.70ft respectively. Two of the main weapons to fight flooding along the Mississippi River are levees and floodways. In 1882 the U.S. Army Corps of Engineers (USACE) in conjunction with the Mississippi River Commission, took on the task of extending the levee system southward from Cairo, Illinois to the Mississippi Delta in Louisiana. With the flood control acts of 1917, and 1928 in response to the “Great Mississippi Flood of 1927”, Congress authorized the construction of floodways to aid in the control of flooding, one of which was the “Birds Point” floodway located in Southeast Missouri. These levees and floodways would be tested many times in the decades to come as massive flooding again occurred in 1973, 1997, and 2008. By early May, the river had already crested in portions of Southern Missouri, which meant the NWS Memphis service area was about to get the brunt of the rivers fury. Evacuations were already taking place in towns along the river in Lake, Lauderdale, and Dyer counties in West Tennessee. Further downstream, officials were preparing for the worst, in and around the Memphis Area. Continuing southward into Mississippi, officials at the popular Tunica Casinos were faced with the decision to close their doors and evacuate, which they did for the first time ever. As the crest of the river continued 5. REFERENCES Duke, Christopher. 2011. 2011 Flood Post Storm Evaluation Team Timeline. Advanced Hydrologic Prediction Service: Memphis , 2011: Available online: http://water.weather.gov/ahps2/index.php?wfo=meg Fig. 6. Mississippi River Flooding in Dyersburg, Tennessee. May 5th, 2011 Fig 7. Mississippi River Flooding in Lauderdale County, Tennessee. May 11th, 2011.