Download
1 / 18
180 likes | 350 Vues
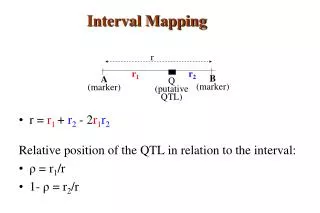
Stats Questions We Are Often Asked What is r and R 2 ? When can I use r and R 2 ?. r – little r – what is it?. r is the correlation coefficient between y and x r measures the strength of a linear relationship r is a multiple of the slope. *. *. *. *. *. *. *. *.

E N D
Stats Questions We Are Often Asked • What is r and R2? • When can I use r and R2?
r – little r – what is it? • r is the correlation coefficient between y and x • r measures the strength of a linear relationship • r is a multiple of the slope
* * * * * * * * y * * * * * * * * * * * * x r – when can it be used? • Only use r if the scatter plot is linear • Don’t use r if the scatter plot is non-linear! r = 0.99
* * * r = 0.57 r = 0.99 * * * * * * * * * * * * * * * y * y * * * * * * * * * * * * * * * * * * * * * x x r– what does it tell you? • How close the points in the scatter plot come to lying on the line
* * * * * * * * * * * * * * * * * * y y * * * * * * * * * * * * * * * * * * * * * * x x R2 – big R2– what is it? • R2 is the coefficient of determination • Measures how close the points in the scatter plot come to lying on the fitted lineor curve
* * * * * * * * * * * * * * * * * * y y * * * * * * * * * * * * * * * * * * * * * * x x R2 – big R2– when can it be used? • When the scatter plot of y versus x is linear or non-linear
y Dotplot of the y’s Shows the variation in the y’s ˆ y x ˆ Dotplot of the y’s Shows the variation in the y’s ˆ x R2– what does it tell you?
ˆ Variation in the y’s This amount of variation can be explained by the model ˆ y y ˆ Variation iny's Variation in fitted values = 2 = R Variation in y values Variation in y's x R2– what does it tell you? We see some additional variation in the y’s. The excess is not explained by the model.
R2 – what does it tell you? • When expressed as a percentage, R2 is the percentage of the variation in Y that our regression model can explain • R2near 100% model fits well • R2 near 0% model doesn’t fit well
* * * * * * * * * * y * * * * * * * * * * x R2 – what does it tell you? • 90% of the variation in Y is explained by our regression model. R2 = 90%
R2 – pearls of wisdom! • R2 and r 2 have the same value ONLY when using a linear model • DON’T use R2 to pick your model • Use your eyes!
Damaged for life by too much TV Causal relationship? r = - 0.93 Health Score TV watching
Causal relationships • Two general types of studies: experiments and observational studies • In an experiment, the experimenter determines which experimental units receive which treatments.
Damaged for life by too much TV Causal relationship? r = - 0.93 Health Score TV watching
Causal relationships • Two general types of studies: experiments and observational studies • In an experiment, the experimenter determines which experimental units receive which treatments. • In an observational study, we simply compare units that happen to have received different levels of the factor of interest.
Causal relationships • Only well designed and carefully executed experiments can reliably demonstrate causation. • An observational study is often useful for identifying possible causes of effects, but it cannot reliably establish causation
Causal relationships - Summary • In observational studies, strong relationships are not necessarily causal relationships. • Correlation does not imply causation. • Be aware of the possibility of lurking variables.


![λ re [nm] = 708.4+45 (((R 664.6 +R 778.5 )/2-R 708.4 )/(R 753.4 -R 708.4 ))](https://cdn2.slideserve.com/4264065/slide1-dt.jpg)