Download
1 / 26
260 likes | 626 Vues
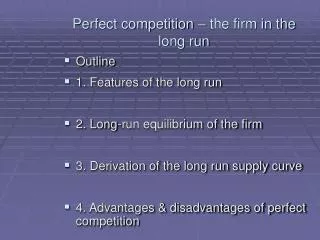
Long Run Perfect Competition with Heterogeneous Firms Overheads. Summary of Long Run Competitive Equilibrium. 1. In the long run, every competitive firm will earn normal profit, that is, zero profit.

E N D
Long Run Perfect Competition with Heterogeneous Firms Overheads
Summary of Long Run Competitive Equilibrium 1. In the long run, every competitive firm will earn normal profit, that is, zero profit 2. In the long run, every competitive firm will produce where price (P) is equal to marginal cost (MC), P = MC. 3. In the long run, every competitive firm will produce where price (P) is equal to the minimum of short run average cost (SRAC), P = SRAC. This implies zero economic profit.
Summary (continued) 4. In the long run, every competitive firm will produce where price (P) is equal to the minimum of long run average cost (LRAC = ATC), P = minimum LRAC. This implies that no identical firms will want to enter or exit. 5. Putting it all together: P = MC = min SRAC = min LRAC
SRMC SRAC LRAC P = MR = Demand LRMC q* Long Run Equilibrium $ Q
Long run equilibrium for low cost firms Not all firms are identical Factors leading to different long run costs Location Control of strategic resources Unique skills
Different costs and competitive equilibrium Price and minimum long run average cost Will price fall to the minimum of LRAC? For some firms but not others Why doesn’t the low cost firm take over? Capacity
Consider an industry with a low cost firm This firm has inherently lower costs Other firms have higher costs Low cost firm can’t supply entire industry at low cost
LRACHC Profit S LRMC LRAC a p* c b D P = MR = Demand q* Long Run Equilibrium for Low-cost Firm $ $ 0 q Q Why don’t other firms enter the market?
LRACHC S LRMC LRAC a p* c b D P = MR = Demand q* Economic Rent The value (Profit) attributed to the strategic resource earns economic rent $ $ 0 q Q
Economic rent is defined as what the supplier of a good or service gets paid above and beyond the amount necessary to induce it to supply the input If this factor is special, the firm should be able to sell it, because presumably, there is a market for a factor that brings extra-normal profits to its owner Thus there is an opportunity cost to holding this special factor If we account for this opportunity cost, the firm makes normal (zero) profit
Changes in Market Equilibria Short run changes in demand Firms expand along SRMC Other firms do not enter
$ b pb a pa D2 qa qb Q Short-run Response to a Change in Demand S D1
AVC ATC MC pa pb qa qb Short Run Equilibrium $ 0 Output
Long run supply curves Are they upward sloping? It depends
Constant cost industries The costs of inputs are constant Even if the industry uses lots more of them Long run industry costs do not change
Long-run supply S1 d SRAC SRMC S2 LRAC b pb pb e b a pa pa LRMC c D2 D1 qa qb Qa Qb Long-run Supply Curve in a Constant-cost Industry $ $ 0 q Q
In the right panel of the figure, we see the market supply and demand curves S1 and D1 for an industry intersecting at point a and resulting in an equilibrium price of pa. In the left panel of this diagram we see the long-run and short-run average and marginal cost curves for a representative firm in the industry. To make matters simple, let us assume that the cost curves for all firms in the industry are identical to these cost curves. Note that since the price pa equals the minimum point on each firm's long-run (and short-run) average cost curve, price pa constitutes a long-run equilibrium price for this market. Now, let demand for this product shift to the right from D1 to D2. In the short run, this increase in demand will cause the price of the good to increase from pa to pb. It will also cause each firm in the industry to make extra-normal profits equal to the area pbdce in the left panel of the figure. Seeing these profits, other firms will enter this industry, which will cause the supply curve to shift to the right. As the supply curve shifts to the right, the price of the good will fall from its newly established level of pb. How much the price will fall depends on what happens to the cost of the inputs to production for the firms in the industry as new firms enter. In this figure it is assumed that as new firms enter, the cost functions of all firms in the industry will stay the same. This will be true if inputs are in abundant supply and if the industry we are looking at only consumes a small share of the inputs in the market. In this case, the expanded size of the industry will hardly be noticed and input prices and costs will remain unchanged. When costs do not change as new firms enter an industry, the short-run market supply curve will shift to S2, where the price of of the good is reestablished at pa. Entry into the industry will stop at this point. Note that the resulting long-run supply curve (the dark arrowed red line in the figure) is flat despite the fact that each short-run supply curve is upward-sloping. Industries such as this, in which the long-run supply curve is flat, are called constant-cost industries. In a constant cost industry, the long run supply curve is horizontal, because each firm's average total cost curve is unaffected by changes in industry supply.
Pecuniary externalities When the actions of one firm cause the price of an input in the market to rise, we say that the firm creates a pecuniary externality When the actions of one firm cause the price of an input in the market to fall, we say that the firm creates a pecuniary economy
Pecuniary externalities Use of all the “good” land or deposits Hiring of all the skilled labor Locking up a whole range of patents Signing of all the good baseball players
Increasing cost industries The costs of inputs rise The cost of production rises They rise because the demand for inputs rises as industry output rises
Long-run supply S1 S3 LRAC3 SRMC1 SRMC3 S2 LRAC1 b pb pb pc pc c a pa pa b D1 D2 Qc qa qb Qa Qb Long-run Supply Curve in an Increasing-cost Industry $ $ 0 q Q With profits to existing firms, other firms will enter But input costs will rise with increased output
Pecuniary economies Economies of scale in input production Increased competition among suppliers Learning by doing
Decreasing cost industries The costs of inputs fall The cost of production falls
S1 LRAC1 SRMC1 b pb pb pa pa a D1 D2 qa Qa Long-run Supply Curve in a Decreasing-cost Industry $ $ 0 q Q With higher prices, firms will expand output With profits available, firms will enter the industry
S1 LRAC1 SRMC3 S3 SRMC1 b LRAC3 pb pb pa pa a c pc pc D1 D2 Qc qa Qa Long-run supply Long-run Supply Curve in a Decreasing-cost Industry $ $ 0 q Q With higher prices, firms will expand output With profits available, firms will enter the industry But input costs will fall with increased output