Download
1 / 1
10 likes | 125 Vues
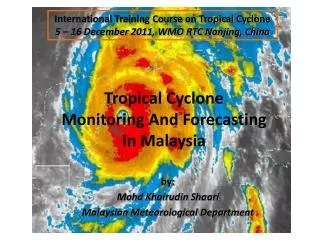
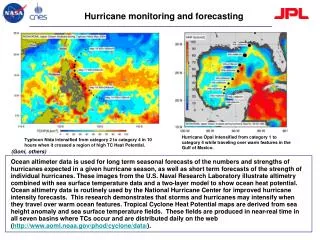
Hurricane monitoring and forecasting. Hurricane Opal intensified from category 1 to category 4 while traveling over warm features in the Gulf of Mexico. Typhoon Nida intensified from category 2 to category 4 in 10 hours when it crossed a region of high TC Heat Potential. (Goni, others).

E N D
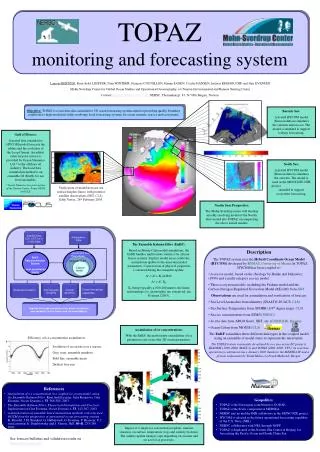
Hurricane monitoring and forecasting Hurricane Opal intensified from category 1 to category 4 while traveling over warm features in the Gulf of Mexico. Typhoon Nida intensified from category 2 to category 4 in 10 hours when it crossed a region of high TC Heat Potential. (Goni, others) Ocean altimeter data is used for long term seasonal forecasts of the numbers and strengths of hurricanes expected in a given hurricane season, as well as short term forecasts of the strength of individual hurricanes. These images from the U.S. Naval Research Laboratory illustrate altimetry combined with sea surface temperature data and a two-layer model to show ocean heat potential. Ocean altimetry data is routinely used by the National Hurricane Center for improved hurricane intensity forecasts. This research demonstrates that storms and hurricanes may intensify when they travel over warm ocean features. Tropical Cyclone Heat Potential maps are derived from sea height anomaly and sea surface temperature fields. These fields are produced in near-real time in all seven basins where TCs occur and are distributed daily on the web (http://www.aoml.noaa.gov/phod/cyclone/data/).