Download
1 / 62
620 likes | 753 Vues
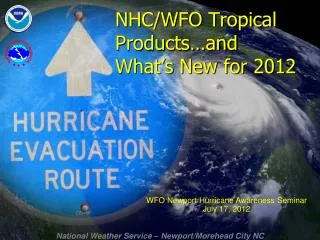
Seasonal Hurricane Forecasting and What’s New at NHC for 2009. 2009 WeatherBug seminar. Eric Blake Hurricane Specialist National Hurricane Center 4/2/2009. Outline. Verification of NHC Forecasts Seasonal Forecasting Brief look at 2009 season What’s New for 2009?.

E N D
Seasonal Hurricane Forecasting and What’s New at NHC for 2009 2009 WeatherBug seminar Eric Blake Hurricane Specialist National Hurricane Center 4/2/2009
Outline • Verification of NHC Forecasts • Seasonal Forecasting • Brief look at 2009 season • What’s New for 2009?
2008 Atlantic Verification VT NT TRACK INT (h) (n mi) (kt) ============================ 000 373 5.7 1.8 012 346 27.7 7.1 024 318 48.3 10.4 036 288 68.6 12.1 048 261 88.2 13.6 072 221 126.914.6 096 177 159.813.8 120 149 191.817.2 Values in green exceed all-time records. * 48 h track error for TS and H only (GPRA goal) was 87.5 n mi, just off last year’s record of 86.2.
Atlantic Track Error Trends Errors have been cut in half over the past 15 years. 2008 was best year ever.
Atlantic Track Skill Trends 2008 was the most skillful year on record at all time periods.
2008 Track Guidance Official forecast performance was very close to the consensus models. Best model was ECMWF, which was so good that it as good or better than the consensus. BAMD was similar to the poorest of the 3-D models (UKMET). AEMI excluded due to insufficient availability (less than 67% of the time at 48 or 120 h).
2008 Track Guidance Examine major dynamical models to increase sample size. ECMWF best at all time periods (as opposed to last year, when it was mediocre). GFDL also better than last year (and better than HWRF). As we’ve seen before, GFDL skill declines relatively sharply at days 4-5. NOGAPS and GFNI again performed relatively poorly. GFNI upgrades were delayed.
Guidance Trends Return to more “traditional” relationships among the models after the very limited sample of 2007.
Guidance Trends Relative performance at 120 h is more variable, although GFSI has been strong every year except 2005. GFDL is not a good performer at the longer ranges.
Consensus Models Best consensus model was TVCN, the variable member consensus that includes EMXI. It does not appear that the “correction” process was beneficial.
Atlantic Intensity Error Trends No progress with intensity.
Atlantic Intensity Skill Trends Little net change in skill over the past several years.
2008 Intensity Guidance OFCL adds most value over guidance at shorter ranges. Modest high bias in 2008 (2007 was a low bias). Split decision between the dynamical vs statistical models. New ICON consensus, introduced this year, was very successful, beating OFCL except at 12 h.
2008 Intensity Guidance When the complication of timing landfall/track dependence is removed, OFCL performs better relative to the guidance. Dynamical models are relatively poor performers.
Color indicates probability of tropical cyclone formation within 48 hours. Outlined areas denote current position only. Low Medium High < 20 % 20-50% >50% Graphical Tropical Weather Outlooks
Summary: Atlantic Track OFCL track errors set records for accuracy at all time periods. Errors continue their downward trends, skill was also up. OFCL track forecast skill was very close to that of the consensus models, was beaten by EMXI. EMXI and GFDL provided best dynamical track guidance. UKMET, which performed well in 2007, did not do so in 2008. NOGAPS lagged again. HWRF has not quite attained the skill of the GFDL, but is competitive. A combination of the two is better than either alone. Best consensus model was TVCN (variable consensus with EMXI). Multi-model consensus – good. Single model consensus – not so good. Not a good year for the “corrected consensus” models.
Summary: Atlantic Intensity OFCL errors in 2008 were below the 5-yr means, but the 2008 Decay-SHIFOR errors were also lower than its 5-yr mean, so no real change in skill. Still no progress with intensity errors; OFCL errors have remained unchanged over the last 20 years. Skill has been relatively flat over the past 5-6 years. Split decision between the statistical and dynamical guidance. Simple four-model consensus (DSHP/LGEM/HWRF/GHMI) beat everything else, including the corrected consensus model FSSE.
Dr. Bill Gray Colorado State University “Scientists consider seasonal hurricane prediction to be, at best, a GRAY area” (Ed Rappaport, NHC, 1991)
Composite of tropical cyclone tracks during 14 moderate to strong El Niño years versus the next year Year after El Niño El Niño Years From Gray 1984
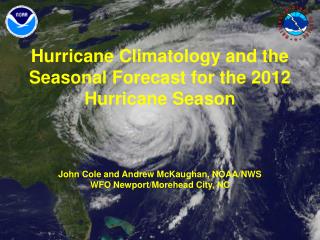
El Niño • Warming of the equatorial waters in the central and eastern Pacific Ocean • A natural phenomenon that occurs every 3 to 5 years • Affects global atmospheric circulation patterns by altering thunderstorm development in the deep tropics • Generally causes a less active Atlantic hurricane season
El Nino La Nina
El Niño versus La Niña El Niño causes extra thunderstorm development over the central and eastern equatorial Pacific. This causes a response in the atmosphere over the Atlantic basin of increased shear and sinking air, causing a drier and more stable atmosphere. Upper winds Hello there it Upper winds La Niña causes a reduction and westward shift in thunderstorms. This forces the maximum sinking air to be located over the eastern Pacific and allows air to rise more freely over the Atlantic basin, in addition to less shear.
Vertical Wind Shear • Tropical cyclones generally require a low vertical wind shear environment to develop, less than about 10-15 mph. • Vertical shear displaces energy away from the center of a tropical system and slows development. • By monitoring early season vertical shear (June-July), you can gain knowledge about the peak of hurricane season from August-October (when 90% of all major hurricanes strike).
200 mb (~40,000 ft) climatology In general, lots of shear in the basin 850 mb (~5,000 ft) climatology
200mb zonal wind anomalies (m/s) during June-July of 10 ENSO events. El Niño La Niña
Sea-Level Pressure • Known to influence hurricanes for at least 70 years. • Pressure is a proxy for multiple qualities in the atmosphere. • Lower pressures are linked to less sinking, which leads to a more moist atmosphere. • Higher pressures in the subtropical high linked to stronger winds, and cooler water temperatures through increased upwelling.
Stations used in the Gray 1984b Sea Level Pressure Calculation Figure courtesy Phillip Klotzbach
Composite map of June-July anomalous surface pressures during 10 active hurricane seasons Lower than normal Higher than normal
Sea-Surface Temperatures (SSTs) • In the Atlantic basin, warmer waters generally mean a more active hurricane season. • Higher SSTs lead to more instability in the boundary layer of the atmosphere. • Changes in SST gradients modulates regional circulation patterns. • Atlantic SSTs also atmospheric proxy. • Cooler waters are linked to higher surface pressures, which are related to stronger surface winds. These stronger surface winds tend to upwell more cool water, which reinforces the cycle. Stronger (easterly) surface winds also produce more shear in the atmosphere (due to the mean westerly state of the upper troposphere).
Direct local relationship between SST and tropical cyclone intensity All other things being equal, an increase of underlying SST will lead to an increase in the maximum intensity that a hurricane can achieve. In a large sample, the mean intensity may also increase, but to a much lesser extent. (Slides on this and the AMM provided by Jim Kossin, UW-CIMSS)
The Atlantic Meridional Mode: SST, wind, and precip anoms • Leading mode of basin-wide ocean-atmosphere interaction between SST and low-level winds • Amplifies via the • wind-evaporation-SST (WES) feedback mechanism • Strongest signal during the spring, but persists into hurricane season
Comparative effects of the AMM (local) and ENSO (remote) on vertical wind shear in the Atlantic units: m/s per standard deviation Shear regressed onto AMM and N34 indices, and correlations between the indices and storm activity.
The AMM, SST, shear, and Atlantic tropical cyclogenesis + genesis point became a major hurricane at some time
Composite map of June-July SST anomalies during 10 active hurricane seasons Colder than average Warmer than average
A good measure of seasonal hurricane activity: “Accumulated Cyclone Energy”, or “ACE” ACE is defined as the sum of the squares of the wind speed every six hours for all tropical storms, subtropical storms and hurricanes. Therefore, ACE is maximized for long-lived, intense hurricanes, such as Ivan (2004).
Note how the SSTs are closely related to total activity (ACE). SST in the Atlantic alone on a 5 year running mean accounts for over 70% of the variability in ACE.
Atlantic Multidecadal Mode (Ocean Temperature) Mestas-Nunez and Enfield (1999)
North Atlantic SST Annual Anomaly (50oN-60oN; 50oW-10oW) 1 2006-2020 1995-04 ? 1926 1969 0.5 0 - 0.5 1925 1970 1994 -1 1900 1910 1920 1930 1940 1950 1960 1970 1980 1990 2000 2010 2020
Florida and U.S. East Coast Major Hurricane Strikes 1903-2005 Cold Atlantic Warm Atlantic
Composite: 200, 850 strm, wind Anti-cyclonic anomalies Stronger Tropical Easterly Jet Cyclonic anomalies Reduced easterly trades Inter-hemispheric symmetry of 200-hPa streamfunction anomalies, and Reversal of equatorial zonal wind anomalies. Reflects global-scale patterns linked to anomalous tropical convection.
NOAA Forecast Methodology • Assess states of the multi-decadal signal, El Niño, and Atlantic SSTs. • Use available CPC/CDC forecasts for El Niño/Atlantic SSTs, incorporate any analog techniques and assume persistence of upper-level conditions. • Predict range of overall activity and probabilities of above-, near-, and below-average seasons. • Qualitative/Quantitative process. • No forecast of hurricane landfalls, just the total seasonal activity for the entire basin.