Download

1 / 20
200 likes | 616 Vues
Tide gauge measurements and analysis of the Indian Ocean tsunami on the Pacific coast of South America. 1 Institute of Ocean Sciences, Sidney, B.C. Canada 2 P.P. Shirshov Institute of Oceanology, Moscow, Russia. A.B. Rabinovich 1,2 and R.E. Thomson 1.

E N D
Tide gauge measurements and analysis of the Indian Ocean tsunami on the Pacific coast of South America 1 Institute of Ocean Sciences, Sidney, B.C. Canada 2 P.P. Shirshov Institute of Oceanology, Moscow, Russia A.B. Rabinovich1,2 and R.E. Thomson1
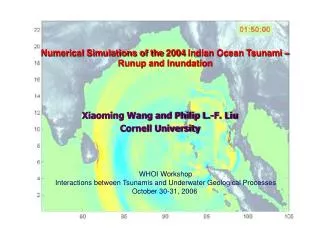
Tsunami of the December 26, 2004 recorded in the World Ocean Maximum tsunami amplitudes computed by V.V. Titov (PMEL/NOAA) [Titov et al., Science, 2005]
MOST model of the December 26, 2005 tsunami Numerical model by V.V. Titov (PMEL/NOAA)
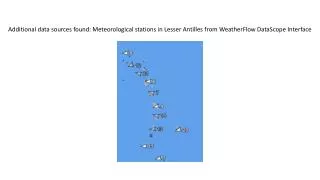
Location of tide gauge stations on the coast of South America
The 2004 Indian Ocean tsunami records on the Pacific coast of South America (4) “Train” structure • Long ringing (>2 days) (5) Maximum waves in 8-30 hrs after the first arrival (in the second or third train) (2) Slow energy decay (3) Unclear first arrival
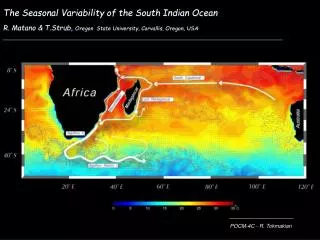
West Indian Ocean Central and East Indian Ocean The 2004 tsunami as recorded in the Indian Ocean • Relatively short ringing • (1-1.5 days) (3) Maximum waves are in the very beginning (2) First arrival is abrupt and clear (4) Fast amplitude decay
North Pacific Ocean Aleutian and Kuril Islands Pacific coast of Canada
Indian Ocean (Sumatra) tsunami of December 26, 2004 Recorded tsunami wave heights along the coast of South America
Tsunami and background spectra “…The spectra of tsunamis from different earthquakes are similar at the same location but are quite different for the same event for nearby locations…” [Omori, 1902, and many others…]
Reconstructed source functions Northern group of stations
Reconstructed source functions Southern group of stations
Averaged source function While individual tsunami spectra are significantly different for different stations, the reconstructed “source function” is supposed to be independent of local topographic effects and be related to the actual spectral characteristics of the source. Good agreement of this function calculated for various sites and different regions supports this assumption.
Reconstructed source functions based on Canadian records (BC coast)
Wavelet plots of the 2004 Indian Ocean tsunami (1) Time: 25/12 18h – 28/12 18h Periods: 2.5h – 0.20h
Wavelet plots of the 2004 Indian Ocean tsunami (2) Time: 25/12 18h – 28/12 18h Periods: 2.5h – 0.20h
Wavelet analysis of the Indian Ocean records Time: 25/12 12h – 28/12 12h Periods: 2.5h – 0.20h (Cocos1: 1.67h – 0.13h)
Conclusions: • The 2004 Sumatra tsunami was the first global-scale tsunami in the “instrumental era” and it was observed throughout the World Ocean, including the North Pacific, North Atlantic and Antarctic Oceans. 2. This tsunami was clearly measured by tide gauges along the entire Pacific coast of South America with wave heights ranging from a few cm (Punta Corona) to 72 cm (Arica).
3. The resonant characteristics of the shelf and coastline strongly determine the observed features of tsunami waves, in particular wave heights and periods; maximum waves were observed at sites having eigen (natural) periods from 30 to 60 minutes. 4. The recorded tsunami waves are characterized by long ringing (>2days), slow energy decay, and clear train wave structure with maximum waves related mainly to the second or third train (8-30 hours after the first arrival); from this point of view these records are quite different from those observed in the Indian Ocean but similar to those observed in the North Pacific and North Atlantic.
5. The observed spectra of tsunami waves had peaks significantly different for different stations; in contrast, these peaks were in good agreement with background peaks at the same sites. Significant tsunami oscillations were observed at stations with local resonant periods of 30-50 min, apparently corresponding to the periods of arriving tsunami waves. 6. In contrast to individual tsunami spectra, the reconstructed “source function” is found to be very consistent and almost independent of local topographic effects and is apparently related to the spectral characteristics of the source.