Download
1 / 24
250 likes | 426 Vues
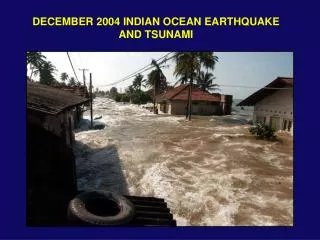
Numerical Simulations of the 2004 Indian Ocean Tsunami – Runup and Inundation. Xiaoming Wang and Philip L.-F. Liu Cornell University. WHOI Workshop Interactions between Tsunamis and Underwater Geological Processes October 30-31, 2006. Outline:.

E N D
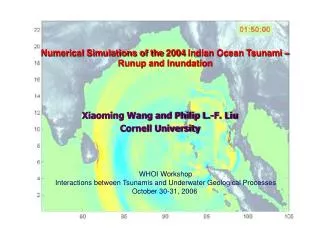
Numerical Simulations of the 2004 Indian Ocean Tsunami – Runup and Inundation Xiaoming Wang and Philip L.-F. Liu Cornell University WHOI Workshop Interactions between Tsunamis and Underwater Geological Processes October 30-31, 2006
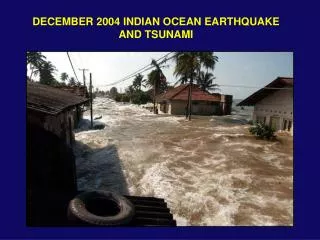
Outline: • Review of the general features of the 2004 Indian Ocean • tsunamis • Numerical simulation results of runup and inundation • in Trincomalee, Sri Lanka and Banda Aceh, Indonesia • 3. Erosion and deposit
Jan 23 2004 Banda Aceh North Shore Dec 28 2004
Southern Banda Aceh (Gleebruk: 31miles southwest of Banda Aceh) 4/12/2004 1/2/2005
January 1, 2004 Kalutara, Sri Lanka December 26, 2005
COMCOT: Nested grid system Linear Shallow Water Equations in Spherical Coordinates:
Non-linear Shallow Water Equations in Cartesian Coordinates: Bottom Frictional stress:
Initial Free Surface Profile Rupture speed: 2 ~ 3 km/s Rupture duration: 10 mins Fault Plane Width: 150 ~ 200km Maximum horizontal displacement: 20 m Maximum vertical displacement: 3 m
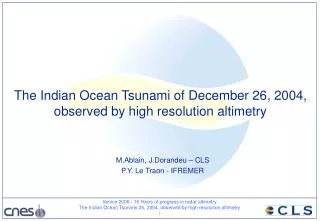
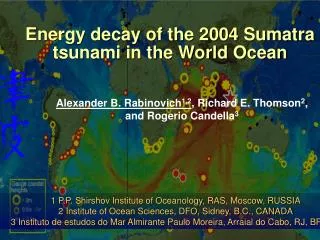
Satellite tracks for TOPEX and Jason-1 animation The colors indicate the numerically simulated free surface elevation in meter at two hours after the earthquake struck
Comparisons between model results and Jason-1 measurements (left) and TOPEX measurements (right)
Tsunami characteristics in the open sea Snapshots of free surface profile along latitude = 6.63) Linear Non-dispersive Waves
Tsunami inundation in Trincomalee (red line shows the inundation line) Comparisons between survey data and numerical results Wave profile animation
Local Bathymetry Effect Mass fluxes inside Trincomalee bay
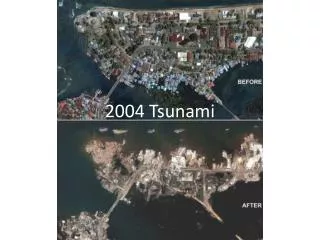
Tsunami Runup and Inundation in Banda Aceh Calculated inundation area (left panel) and comparison with satellite image (right panel) animation
Calculated tsunami heights at the Surveyed locations North shore West coast
Sediment transport Shield parameter
Sediment movement potential around Banda Aceh Gray color stands for regions where Arrows denote the direction of bottom shear stress. The clock shows the time after the main shock
Time history of θ averaged within an 800m-by-800m window near Lampuuk. Positive value means that the flow is in onshore direction and negative value means that the flow is in offshore direction.
Sediment erosion and deposit Mass conservation θc= 0.06 porosity of sand (λ = 0.3) mean sediment diameter (ds = 0.5mm )
Ulee Lheue Change of bathymetry and topography At Banda Aceh 2 hours after main shock. The color scale is in meters. Positive value means deposit and negative value Suggests erosion. Lampuuk Transect of seafloor elevation. The thick blue line shows the original sea bottom and the red thin line denotes the calculated sea bottom 2 hours after the earthquake. Black line stands for the still sea level.
Concluding Remarks • COMCOT provides reasonable results for arrival time, wave height • and runup; • Shield parameter is used as an index for potential sediment • movement; • A simple sediment transport model is implemented, using the • COMCOT results as an driving force. • The sediment transport model needs to be improved and validated.