Download
1 / 22
220 likes | 461 Vues
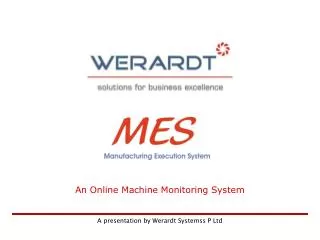
An Online Machine Monitoring System. The MES Overview. ERP. Field Controls. MES. Third Party Interface Customization. Online Factory Production Data. Plug-n-Play Connectivity. Hardware Independent. Open End Connectivity To Various Interfaces. The MES Overview. FTM-MES.

E N D
The MES Overview ERP Field Controls MES
Third Party Interface Customization Online Factory Production Data Plug-n-Play Connectivity Hardware Independent Open End Connectivity To Various Interfaces The MES Overview FTM-MES
The MES Solution in Brief If you are looking at an Online System to monitor Shop floor data of a designated Machine or Section or Line, then FTM-MES is the system you should consider. FTM-MES along with our FTM Maintenance software can form a very effective tool in TPM implementation The System would interface with the Machine/Line output and, with the help of earlier entered Production plan, compute the efficiency or Yield of the line. These figures would be made available on a shift/day basis along with cumulative figures for that shift/day. Similarly machine stoppage signal would be made available to display the working status of the machines in the line. The data would be stored in a Database on your Server and the MES System will be available to users for viewing live information and MIS based on user access control as set by an Administrator for this system.
The FTM-MES Solution • Production Data, This could be made available from every or last machine in the process line to indicate the number of jobs or pieces produced in the shop. This will then be compared with the planning figures entered separately in the MES software to compute the Yield • Machine Stoppage Data, from every Machine on the shop-floor so as to indicate a machine Stoppage along with the reason if possible. In case of a CNC machine this could be made available from the machine itself • The FTM-MES software, on a Server will provide various graphical outputs on the screen as well as in MS-Excel and this will be controlled through user access rights controlled by an Administrator • Display on the Shop-floor, Optionally, a Large LCD screen or Rolling LED display could be interfaced with the system on which various information screens could be flashed on a periodic basis, on the shop floor, if required
The various Data capture schemes For Production Data Capture Option-1 This can be a purely file based solution, where we will have access to a file being generated by the Machine/Line indicating the number of pieces produced in that shift or on that date. You will have to provide all necessary details of the file for us to interface. Option-2 This can be through an electronic interface, from the Digital Counter output indicating the number of pieces produced by the machine/line. The signal should be made available for us to interface Option-3 This could be a totally manual entry at the end of every shift, which would contain production data, rejection data, stoppages, and defects detected For Machine Stoppage Data Capture Option-1 This can be through an online file interface indicating the Stoppage start date/Time and then the End Date/Time. This could also give us the Stoppage code Option-2 This can be through an HMI (Human Machine Interface) device connected on every machine where the operator will manually indicate a machine stoppage along with the stoppage code entry into the device Option-3 This can be using a set of Push buttons mounted on a Panel, using which the operator will operate to indicate machine stoppage and then machine start
System Architecture MES System Production Data Options Machine Stoppage Data Options PLC in case of H/W Interfaces OR OR OR Data File Counter Data File HMI P.B. Panel
Product Features • Latest .NET Technology is used and the system can be hosted on Organizational Intranet Site, thus easily accessible with restricted access based on the Security profile • Production Data, You can define the Production Order No. against which Production losses are taking place • Reporting, The system will generate pre-defined reports to display Production efficiencies and Stoppage statistics. These reports have been developed in MS-Excel • User friendly Graphical Online Viewer is provided to view the Machine wise Production Uptime and Lost Time over a time line in a Graphical format • Real time Statistics of Overall Equipment Efficiency (Runtime or Cutting time or OEE) is provided to get to know the exact Stoppage time along with an online indication of this OEE
Online Viewer The Online or History Viewer The Online Viewer indicates the Running and Stoppage of the Machines on which a HMI device is connected in Real Time and the History Indicator in the same format indicates the machine status of any previously selected date. The Real Time or Shift Time Indicator You can either view the proceedings in Real time or Shift time with a zooming facility to zoom 8 hrs of working at a time. Scrolling Indicator As you move the cursor on any Stoppage block the system displays the details of the stoppage in a dynamically placed scroll block Color Indicators Green indicated that the machine is running i.e. Cutting time is going on, Blue indicated all Productive Stoppages, Red indicates all Non-Productive Stoppages, and Yellow indicates the loss of Communication with the device
Online Viewer Real Time/Shift Time Set the time option to view the data of the specified period. Real Time / History Viewer Displays real time data and the historical archive of the machine’s status as running or stopped. Machine Running Productive Stoppages Non-Productive Stoppages Communication Failure Scrolling Indicator Displays the stoppage details as the cursor is moved dynamically over the scroll block.
Online Register The Online or History Register Similar to the Viewer, the register gives a detailed listing of the Stoppages along with Downtime in a chronological order, with a total of the downtime as of now or the selected date range. Online OEE Indicator In case of viewing the register in Real time, the system computes the current OEE for the selected range at the bottom of the screen. Filtering You can filter the indicated data for a Particular Machine or Stoppage to get the desired results instantly on the screen.
Online Register Online OEE This is the Machine Utilization % made available online based on Real time data.
Web enabled Viewing View from anywhere in the Plant As mentioned earlier, the system is a Web application hosted on an Intranet Server, hence you can also view the Online Viewer and Register directly from any PC in the plant using your Internet Browser. URL for Online Viewer The address or URL of the Online Viewer is http://<server>/FtmProductionModule/MachineDownTimeStatus.aspx URL for Online Register The address or URL of the Online Viewer is http://<server>/FtmProductionModule/OnlineMachineStopageRegister.aspx
Information Outputs • Reports are available in graphical form in MS-Excel for the specified date range and set of filters • The Reports that are available are … • Daily Production Chart • Daily Machine Utilization Chart • Stoppage Code Pie Chart • Stoppage wise Pareto Analysis • Machine wise Pareto Analysis • Monthly Machine Utilization Chart • Machine wise Utilization Chart … and various such outputs would be made available online
Contact Information Werardt Systemss Pvt Ltd Pune, India Phone : 91-20-25285256, 25285257 Website : http://www.werardt.com email: business@werardt.com